
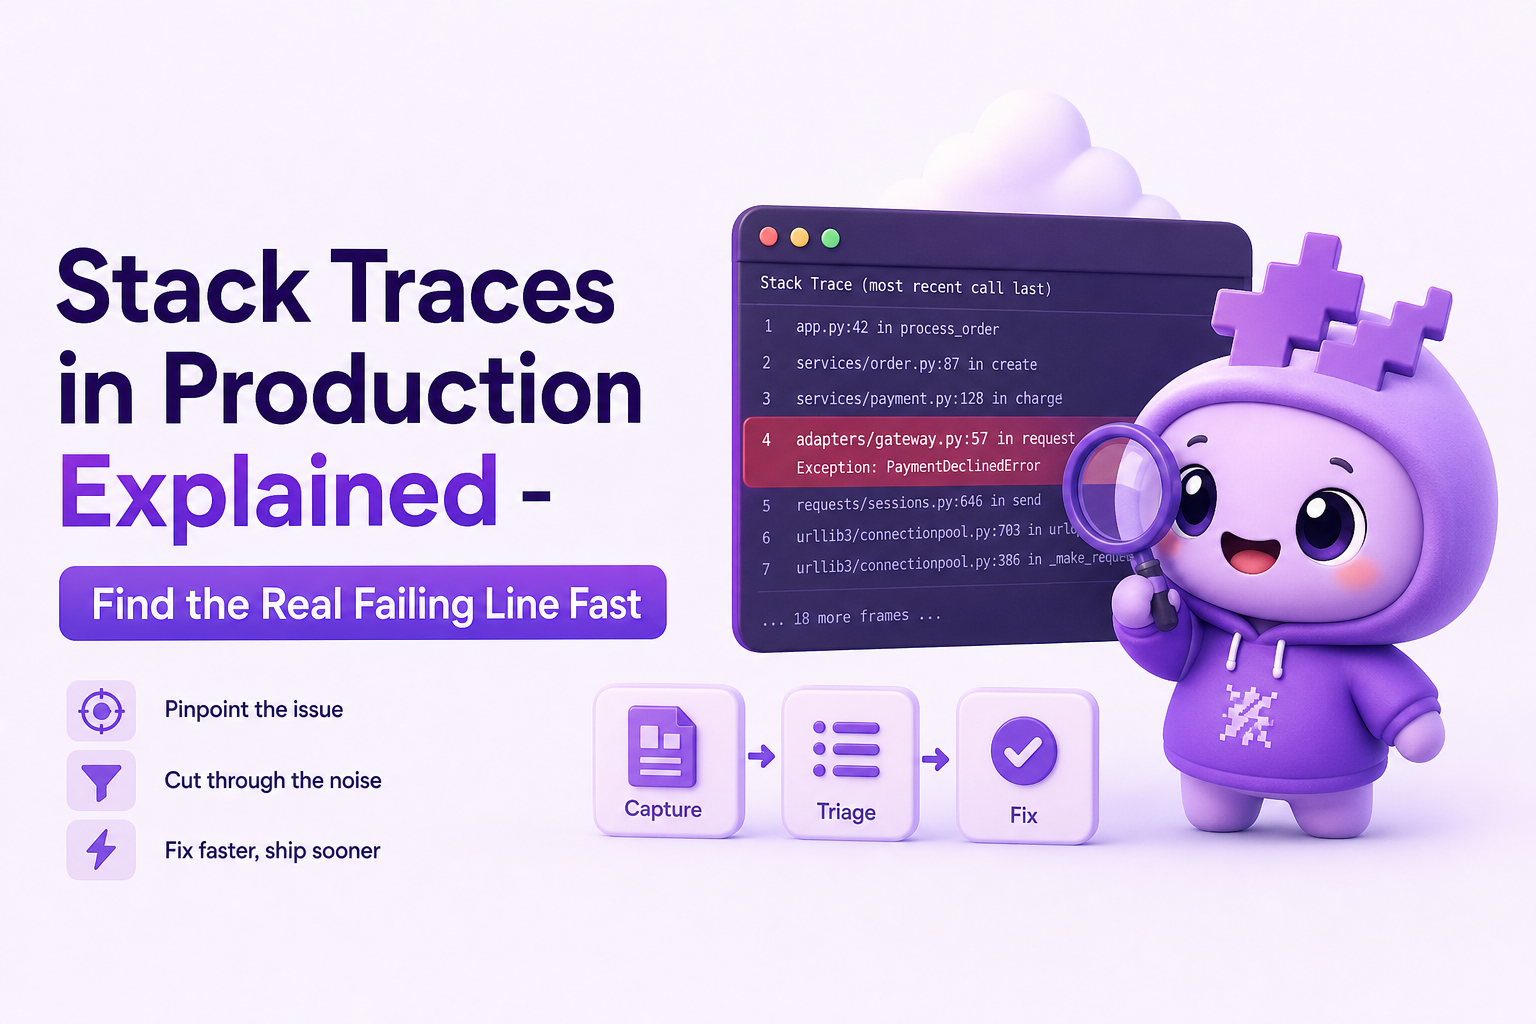
Stack Traces in Production Explained - Find the Real Failing Line Fast
You get a production alert, users are blocked, and the only hard clue is a wall of stack traces pasted into Slack. The pressure is not just to understand what happened, but to decide what to do next before the incident burns a sprint. The problem is that most traces include more framework and runtime noise than signal, so teams chase the wrong frame, misread the exception, or waste time trying to reproduce the wrong scenario. This guide gives you a repeatable way to read stack traces as a fast triage tool, isolate the real failure point, and convert the trace into an actionable next step within minutes.
- Start with the exception type and message, then verify the topmost app-owned frame that actually executed.
- Use a 5-minute flow to separate framework noise from the root frame and extract a concrete next action.
- Reduce repeat work by grouping similar stack traces and attaching the minimum context needed to reproduce.
What is stack traces
Definition in plain English
A stack trace is a snapshot of the call stack at the moment an error occurred. It lists the chain of function or method calls that led to the failure, typically from the most recent call (closest to the crash) back through earlier calls. In practice, stack traces answer: “What code was running, and how did we get here?”
What you can reliably learn from a stack trace
- Failure type: the exception class (for example,
NullPointerException,TypeError,KeyError). - Failure message: the runtime’s description (for example, “Cannot read properties of undefined”).
- Candidate failing location: file, class/function, and line number (when symbols and source maps are correct).
- Execution path: which functions were called leading up to the crash.
What stack traces do not tell you (common misconceptions)
- They do not guarantee root cause: the crash line is often where the program notices the problem, not where the bad data entered.
- They do not include business context: which user action, request payload, feature flag, or release introduced the state.
- They can lie when symbols are wrong: minified frontend bundles without correct source maps can point to misleading lines.
- They can be “secondary errors”: the first failure triggers cleanup code that throws a new exception, masking the original.
How it works - what you are actually seeing in a trace
The typical fields you should scan in order
- Exception type and message
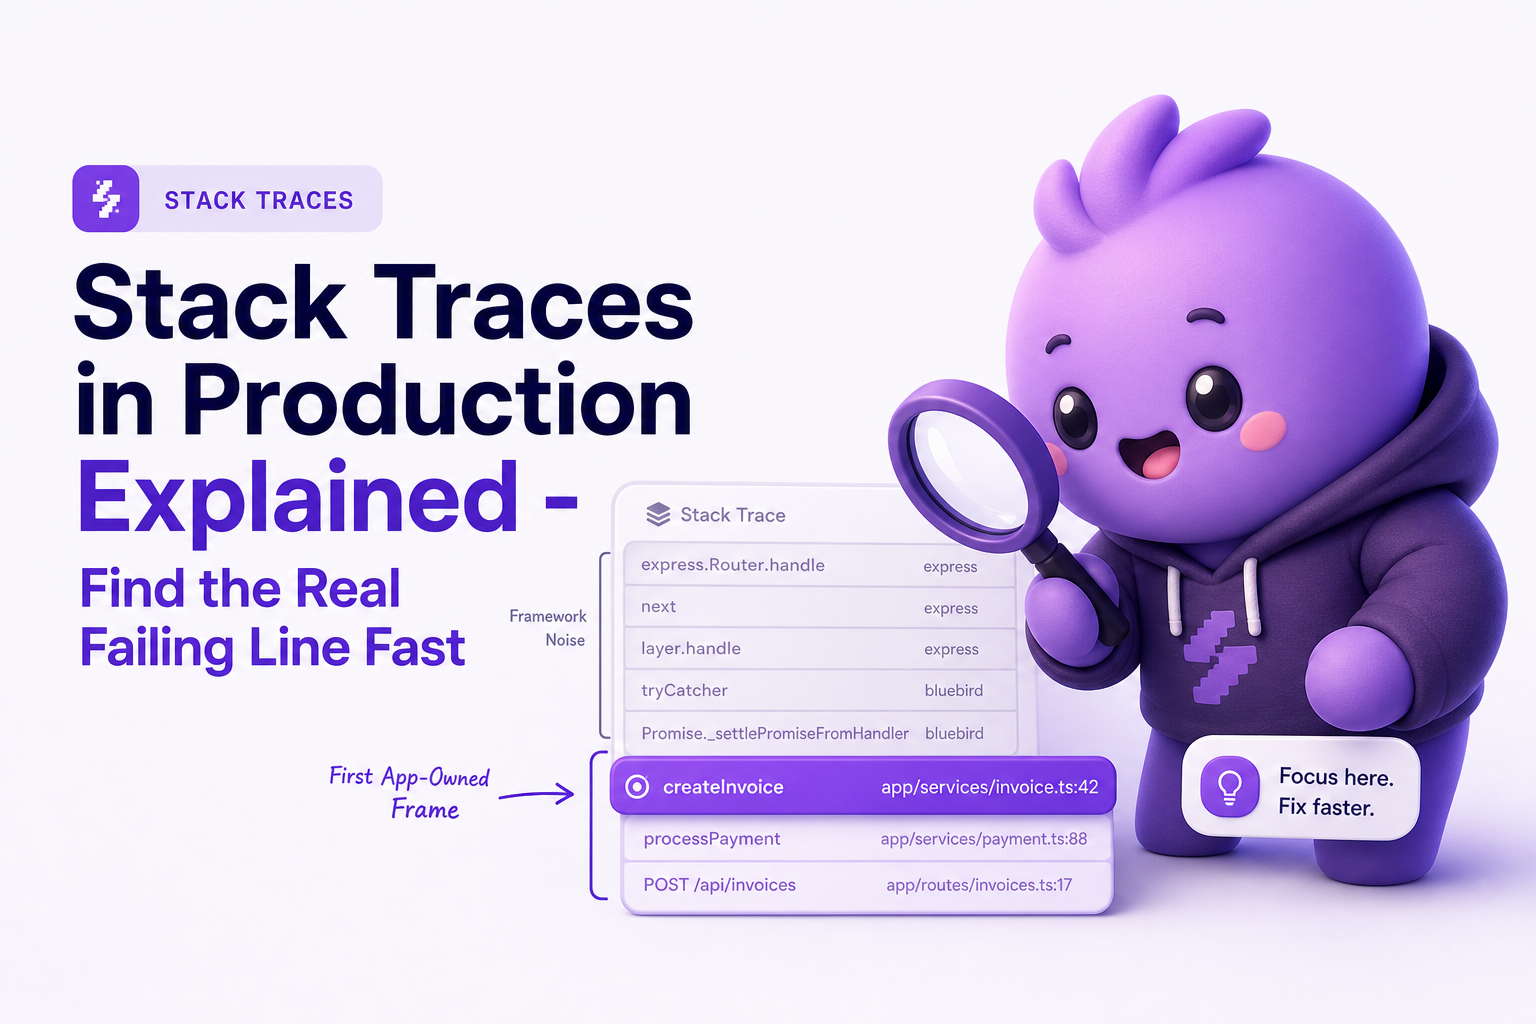
- First app-owned frame (your repository code, not the runtime or framework)
- Request or event boundary (controller, handler, job runner, message consumer)
- Thread/task info (async context, worker, queue name)
- Environment metadata (release version, host, region, browser, OS)
Why the “top line” is not always the one you fix
Many developers treat the first line as the answer. In production, that is risky for three predictable reasons:
- Framework wrappers: the top frames are often framework dispatch code (Express, Spring, Rails middleware, React internals). Fixing those is rarely the goal.
- Async boundaries: promises, callbacks, and background jobs can break the causal chain. The frame where the error is thrown might be far from where the bad value originated.
- Error handling code throws: logging or error reporting code can throw its own exception, producing misleading stack traces.
Mini example: frontend TypeError with framework noise
TypeError: Cannot read properties of undefined (reading 'price')
  at renderPrice (PricingModal.tsx:88:19)
  at PricingModal (PricingModal.tsx:41:11)
  at renderWithHooks (react-dom.production.min.js:14985:18)
  at updateFunctionComponent (react-dom.production.min.js:17356:20)
  at beginWork (react-dom.production.min.js:19063:16)
The actionable part is the first app-owned frame: renderPrice (PricingModal.tsx:88). The React frames tell you the runtime context, but they are not where you change code.
A 5-minute method to read stack traces and find the real root frame
Step 1 (30 seconds): classify the exception into one of 4 buckets
This classification determines what you do next. Use the exception type and message to assign a bucket:
- Data contract error: missing field, wrong type, unexpected null, schema mismatch (often
TypeError,KeyError,NullPointerException). - Dependency error: timeouts, connection refused, DNS, upstream 5xx.
- Logic/branch error: “should never happen” states, invalid enum, assertion failures.
- Resource/limit error: OOM, too many open files, rate limit, payload too large.
Decision rule: if the message references a missing property or null access, assume data contract first until proven otherwise.
Step 2 (60 seconds): find the first app-owned frame and confirm it executed
Scan from the top down and mark the first frame that is clearly your code (your package namespace, your repo paths, your source map resolved file). Then verify it is not just a wrapper by checking:
- Is the function name domain-specific? (for example,
calculateTax,applyDiscountvsdispatch,invoke). - Is the file in your repo? not
node_modules, not JDK, not framework internals. - Does the line number map to executable code? not a comment or import line (a sign of bad source maps).
If the first “app frame” is a generic wrapper, skip to the next app frame. This is the most common reason stack traces waste time in production.
Step 3 (60 seconds): identify the boundary frame that explains “what kind of event was this?”
Before you hypothesize a fix, locate the boundary that tells you what triggered the code path:
- HTTP: controller, route handler, middleware, RPC method.
- Async job: queue worker, cron runner, batch processor.
- Realtime: websocket message handler, subscription callback.
- Client UI: click handler, form submit handler, component render path.
Output you want: “This happened in checkout submit”, not “This happened somewhere in the backend.” That single sentence turns stack traces into a triage tool.
Step 4 (90 seconds): translate the failing line into a specific hypothesis
Use a strict template so you do not spiral into guesswork:
- Observed: what the exception says (for example, reading
priceof undefined). - Required: what must be true for the line to work (for example,
itemmust exist and haveprice). - Broken assumption: which input could violate that (for example,
items[]contains a null entry, or API returned missing field). - Most likely source: where that input comes from (API response, DB row, cached object, user input).
This forces a testable hypothesis and prevents “fixing” the wrong frame.
Step 5 (60 seconds): decide the next action using a 3-way decision
Pick exactly one next step based on what the trace can and cannot tell you:
- Reproduce locally when the boundary is clear and you can craft an input (for example, a request payload or UI steps).
- Add targeted instrumentation when the failing input is unknown (log one variable or one response field at the boundary, not everything).
- Roll back or feature-flag when impact is high and the trace points to a recent release area (use release metadata if available).
Benchmark: if you cannot choose one of the three in under 5 minutes, the stack trace is missing context. Your next step should be to capture the boundary context, not to keep reading.
Key benefits of using stack traces as a production triage tool
1) Faster isolation of the “first fixable frame”
When you consistently identify the first app-owned frame, you reduce the time spent reading framework noise. In many incidents, that is the difference between a 10-minute patch and an hour of misdirected digging.
2) Better handoffs between on-call and feature engineers
A good triage note includes: exception type, first app frame, boundary frame, and one hypothesis. That is enough for the next engineer to start with momentum instead of re-parsing the stack traces from scratch.
3) Cleaner prioritization by grouping similar failures
Stack traces can be grouped by exception type plus the first app-owned frame. This helps you see whether you have one bug affecting 500 users or five unrelated bugs each affecting 2 users.
4) More reliable rollbacks
If the trace includes release version and you can tie the failing frame to a recent deploy, rollback decisions become evidence-based instead of fear-based.
Common mistakes teams make with stack traces in production
Mistake 1: fixing the first line without confirming ownership
If the top frames are framework code, you can waste time trying to “fix React” or “fix Express” when the real issue is a null value in your own component or handler. Always locate the first app-owned frame.
Mistake 2: treating every trace as unique
In production, the same bug can generate thousands of stack traces with tiny variations (different user IDs, different request IDs). Group by exception type and root frame before creating multiple tickets.
Mistake 3: ignoring async context and losing the real cause
Async boundaries can hide the origin of bad state. If you only look at the throw site, you might patch symptoms. Add one log at the boundary (job payload, request body shape, websocket message type) to find the source.
Mistake 4: relying on line numbers when source maps or symbols are wrong
If frontend stack traces point to minified bundles or line numbers that do not match the repo, treat the location as approximate. Verify source map upload and release mapping, or you will chase ghosts.
Mistake 5: logging too much instead of the one missing variable
Over-logging slows triage. A better pattern is: log one invariant at the boundary (for example, “cart.items length” and “first item shape”), then re-check the trace after one deploy.
| Goal | What to extract from stack traces | Concrete output | Next step |
|---|---|---|---|
| Find the fixable location | First app-owned frame | PricingModal.tsx:88 | Inspect that function and its inputs |
| Understand the trigger | Boundary frame (route/job/UI action) | POST /api/checkout handler | Reproduce with a crafted request |
| Reduce duplicate work | Exception type + root frame | One grouped issue instead of 50 | Deduplicate and prioritize by impact |
| Decide rollback urgency | Release/version metadata | web@2.3.1 | Rollback or feature-flag if high impact |
FAQ
How many lines of a stack trace should I read?
Read until you find the first app-owned frame and the boundary frame. In many cases that is 5 to 15 lines. After that, stop and form a hypothesis.
What is the “root frame” vs the “root cause”?
The root frame is the first fixable line in your code that appears in the stack trace. The root cause is the underlying reason it failed, often bad input or state created earlier.
Why do my frontend stack traces point to minified files?
That usually means source maps are missing or not correctly associated with the production release. Without correct source maps, line numbers and function names can be misleading.
How do I group stack traces to avoid duplicate tickets?
Group by exception type plus the first app-owned frame (file and line). Then split only if the boundary differs meaningfully, like different endpoints or different user actions.
If you want stack traces to arrive with the missing production context already attached, Flash Log can capture real user failures automatically, preserve the path into the bug, and package a ticket-ready summary so engineering can move from trace to next action faster.
Unknown Author
Stay in the loop
Weekly tactics to reduce debugging time, automate bug reporting, and ship faster without breaking production.