
API Errors in Production - A Triage Framework to Find the Cause Fast
When api errors hit production, teams often lose hours because they chase symptoms instead of the fastest confirming signal. A spike in 500s might be a bad deploy, but it could just as easily be an auth outage, a rate limit, a DNS issue, or an upstream dependency timing out. This guide gives you a practical triage framework to classify api errors in minutes, collect a minimal evidence pack, and choose the next debugging step that is most likely to reduce uncertainty quickly.
- Classify api errors into five buckets (client, auth, rate limit, upstream/network, server) before deep investigation.
- Use a minimal evidence pack per failing request to cut guesswork: request fingerprint, user journey step, response details, and environment.
- Map each bucket to the fastest next check so you can confirm or eliminate causes in under 10 minutes.
What counts as an API error in production and why it is often misdiagnosed
An “API error” in production is any API interaction that fails to meet the contract your client expects. That includes obvious failures like HTTP 4xx/5xx, but also “soft failures” such as timeouts, malformed JSON, schema drift, and partial success where the response is 200 but missing required fields.
Symptoms vs causes - the core reason teams waste time
Most api errors present as a symptom (for example, “checkout submit returns 500”), while the cause lives elsewhere (for example, “upstream payment provider timed out and your handler did not degrade gracefully”). If you start with the symptom and jump straight into code review, you often miss faster confirming checks like “did a dependency’s latency spike at the same time?”
Production makes errors look different than staging
- Traffic shape changes behavior: rate limits, connection pool exhaustion, and hot partitions show up only at production QPS.
- Real user diversity: browsers, devices, locales, and edge networks introduce unexpected request variants.
- Dependency reality: third-party APIs have brownouts, and internal services can have partial outages.
A quick definition that helps triage
For triage, treat api errors as “a request failed at some boundary.” Your job is to identify which boundary failed first:
- Client request formation boundary
- Authentication and authorization boundary
- Quota and rate limit boundary
- Network and upstream dependency boundary
- Your server application boundary
Why api errors in production matter
In production, api errors are not just technical noise. They translate directly into broken user flows, support volume, failed revenue events, and slower engineering cycles. The cost is usually dominated by time-to-root-cause, not time-to-fix. If it takes 2 hours to confidently identify the failing boundary, your team burns the sprint even if the patch is small.
Benchmarks that make triage measurable
You can make debugging speed measurable with three numbers:
- MTTD (mean time to detect): how long until you notice the error spike.
- MTTC (mean time to clarity): how long until you can state the likely failing boundary and the top 1 to 2 hypotheses with evidence.
- MTTR (mean time to resolve): full fix and verification.
This article focuses on lowering MTTC. A realistic goal for common api errors is under 10 to 15 minutes to clarity for the initial classification and next check, even before you open a full debugging session.
Why logs and metrics can mislead
- Aggregates hide the “first failure”: a 500 rate spike might be downstream timeouts that your server converts into 500.
- Sampling misses rare but critical paths: only the highest value flow might be failing.
- Retries distort reality: clients retry, gateways retry, SDKs retry, and the “error” you see is the last attempt.
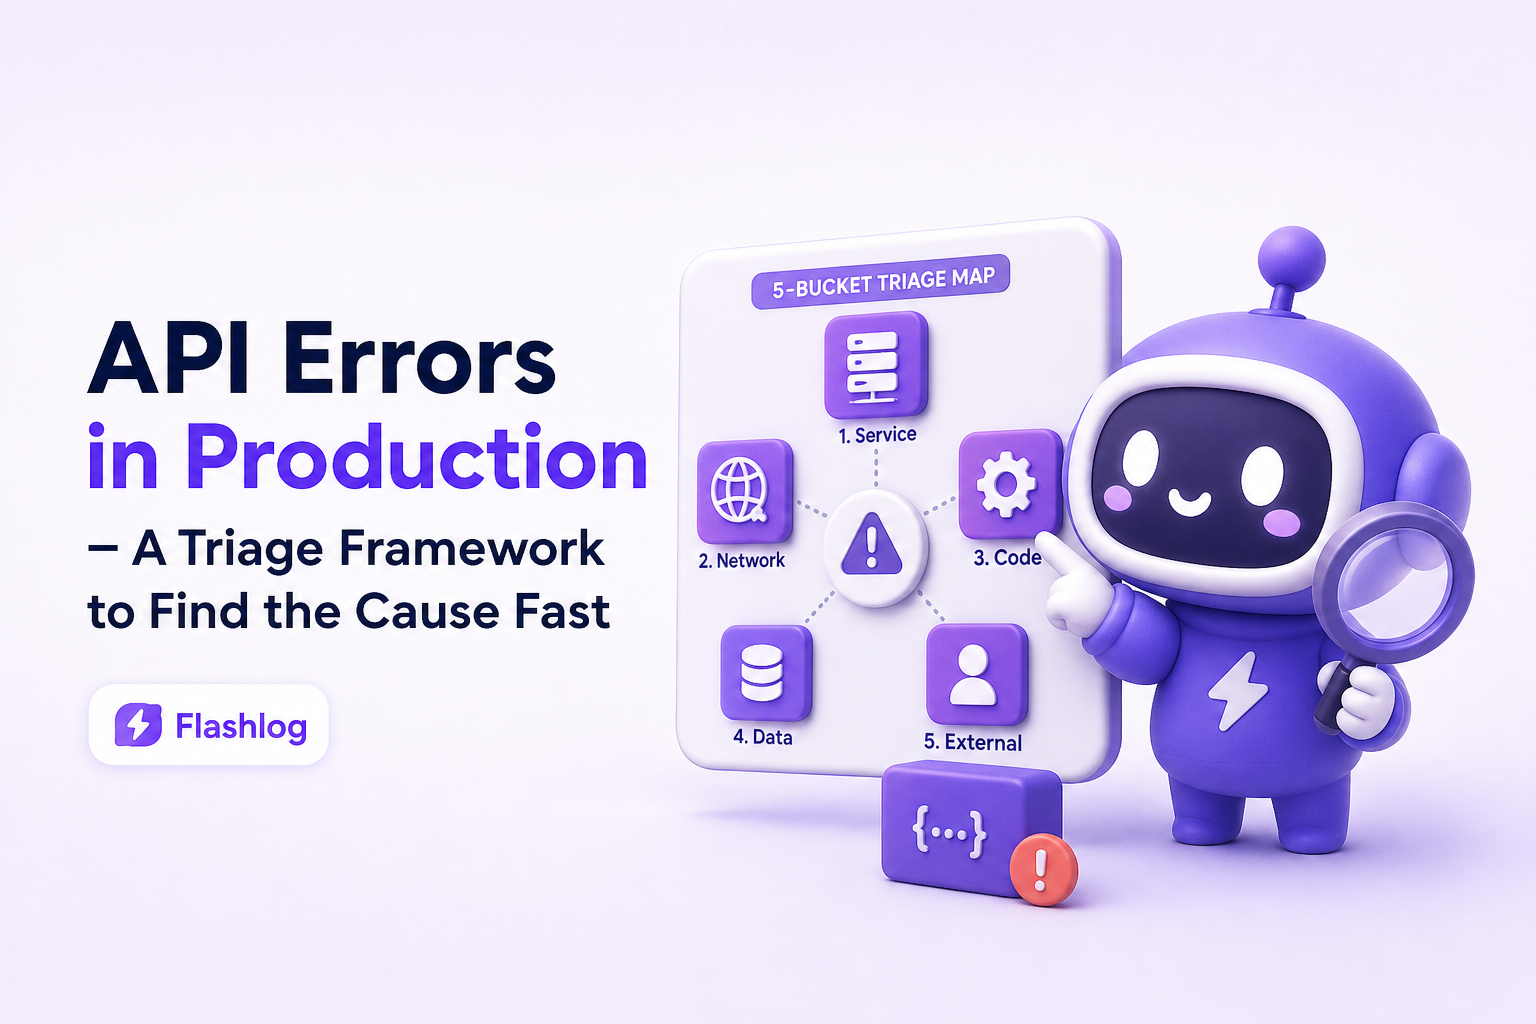
Core framework - a 5-bucket triage system for API errors
The fastest way to debug api errors is to classify them into one of five buckets and run the shortest confirming check for that bucket. Do not start with “read the code.” Start with “identify the boundary.”
Bucket 1 - Client and request formation errors (most 400s)
Typical signals
- HTTP 400, 404, 405, 415, 422
- Sudden increase after a frontend release
- Errors concentrated on a specific device, browser, or app version
Fastest next checks (5 minutes)
- Confirm the exact request fingerprint: method, path, query, headers, body shape.
- Compare against the contract: OpenAPI, validation rules, expected content-type.
- Check for routing mismatches: trailing slashes, versioned paths, missing base path behind a gateway.
Concrete example: A checkout request fails with 415 Unsupported Media Type. The fastest fix is often client-side: a mobile client sends Content-Type: text/plain after an SDK upgrade. The server is fine, but validation blocks the request.
Bucket 2 - Authentication and authorization errors (401 and 403)
Typical signals
- HTTP 401 Unauthorized or 403 Forbidden spikes
- Errors start right after identity provider changes, key rotation, or cookie policy changes
- Only certain roles or tenant IDs are affected
Fastest next checks (10 minutes)
- Validate token presence and format: is the header present, is it the right scheme (Bearer), is it expired?
- Check clock skew: if many tokens appear “not yet valid” or “expired,” compare server time and auth server time.
- Confirm audience and issuer: common after environment misconfiguration.
Concrete example: A 401 spike begins after deploying a new API gateway config. The gateway strips the Authorization header for CORS preflight paths, causing the backend to reject requests. The fix is configuration, not backend code.
Bucket 3 - Rate limiting and quota (429 and throttling patterns)
Typical signals
- HTTP 429 Too Many Requests
- Latency increases before error rate increases
- Errors cluster by IP, user, or API key
Fastest next checks (10 minutes)
- Identify the limiter: CDN, gateway, service mesh, application, or third-party API.
- Check limit headers:
Retry-After,X-RateLimit-Remaining, vendor-specific headers. - Look for retry storms: client retries without jitter can multiply load and create self-inflicted api errors.
Concrete example: A background job deploy increases polling frequency from 60 seconds to 5 seconds, triggering 429s. The fastest mitigation is to revert the poll interval or add backoff, not to scale servers.
Bucket 4 - Upstream dependency and network failures (timeouts, DNS, TLS, 502/503/504)
Typical signals
- HTTP 502, 503, 504, or connection errors
- Timeouts that correlate with a single dependency
- Regional patterns (only certain data centers or ISPs)
Fastest next checks (10 minutes)
- Confirm where the timeout happens: client-side, gateway, or server outbound call.
- Check dependency health and latency: dashboards, status pages, synthetic checks.
- Inspect recent networking changes: DNS, certificates, firewall rules, egress policies.
Concrete example: Your API returns 504 at the gateway. The backend logs show requests still running at 31 seconds. The gateway timeout is 30 seconds. The next step is to shorten backend work, add async processing, or increase gateway timeout with care.
Bucket 5 - Server application errors (most 500s)
Typical signals
- HTTP 500, 501, 503 (from your service)
- Error rate spikes after a deploy
- Errors correlate with one endpoint, tenant, or feature flag
Fastest next checks (10 to 15 minutes)
- Correlate with release and config: did the spike start at a deploy timestamp or after a flag flip?
- Check for input-driven crashes: one malformed payload can trigger a code path that throws.
- Confirm resource saturation: DB connection pool, thread pool, memory pressure, queue depth.
If you do need to go deeper, stack traces matter, but they are not always the fastest first step. If you want a focused guide on reading them quickly, see our article on stack traces.
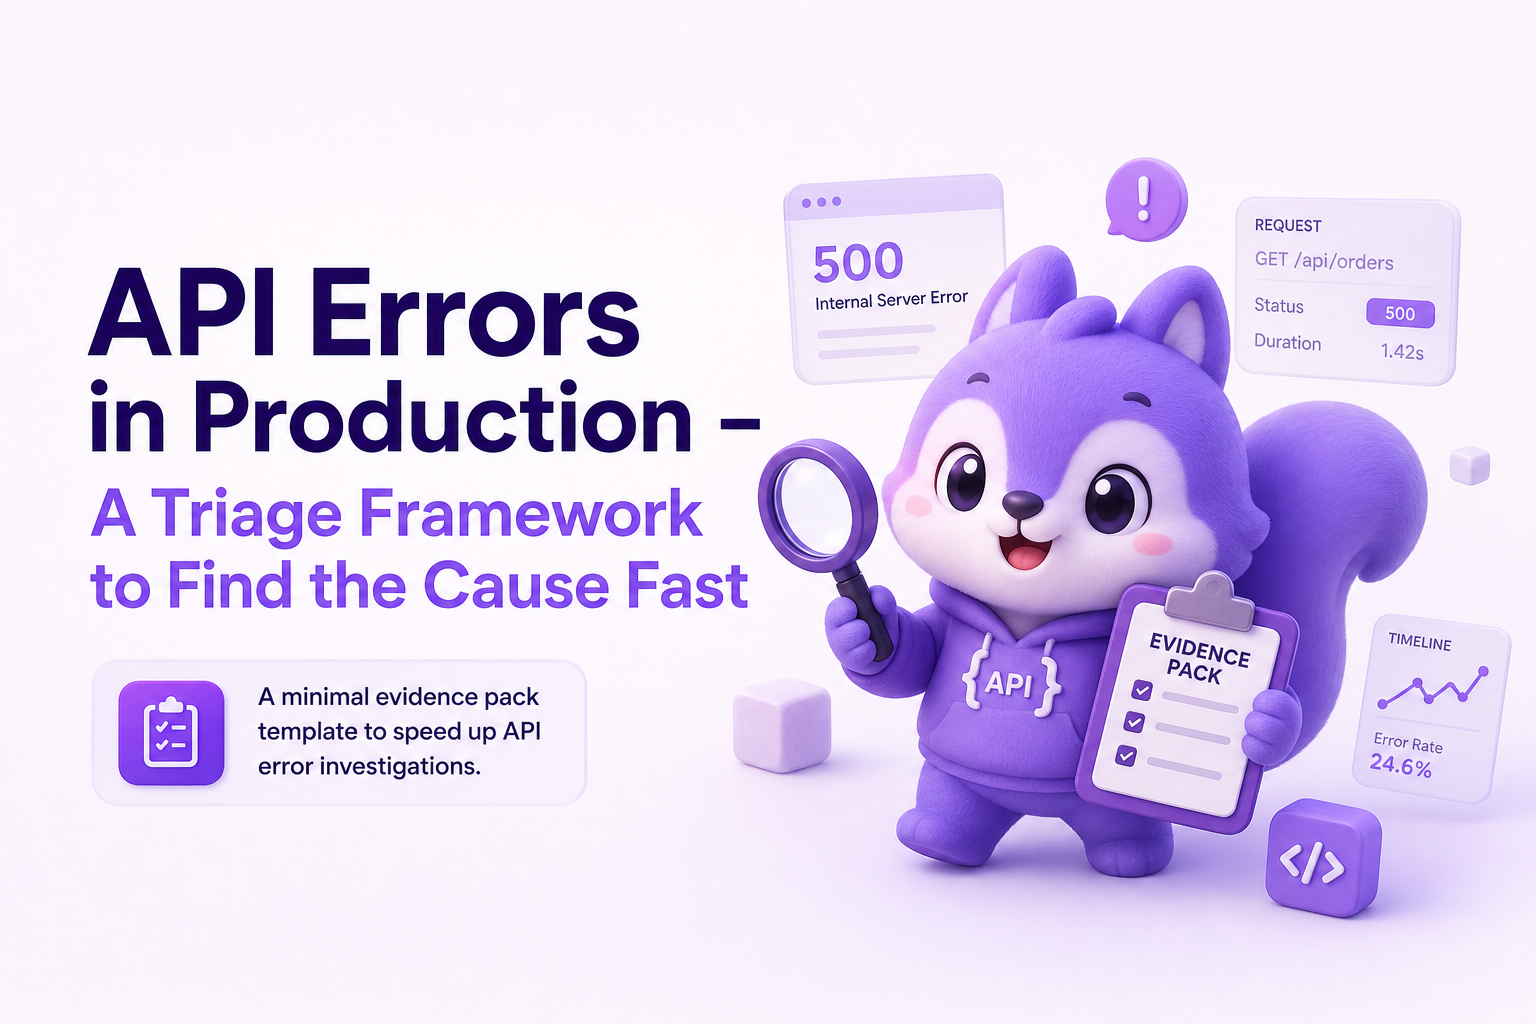
Debug faster with a minimal evidence pack you can collect in minutes
Once you have a bucket hypothesis, collect a minimal evidence pack for one representative failing request. The goal is not to gather everything. The goal is to gather the smallest set of facts that lets another engineer reproduce or confirm the failing boundary without back-and-forth.
The minimal evidence pack (copy/paste template)
- Request fingerprint: method, full path, query, headers (redacted), body schema (not raw secrets)
- Response facts: status code, error code, response headers, response body snippet (redacted)
- Timing: client observed latency, server processing time if available, timeout thresholds
- Environment: region, service version, commit or release tag, feature flags, gateway version
- User journey step: what action triggered it and what happened right before
- Impact snapshot: affected users count, endpoints affected, start time, current rate
How the evidence pack maps to each bucket
- Client/request formation: you need the exact payload shape and content-type.
- Auth: you need token metadata (issuer, audience, exp) and whether headers were forwarded.
- Rate limit: you need limit headers, identity key (API key, user ID), and retry behavior.
- Upstream/network: you need dependency name, call duration, error type (DNS, TLS, timeout).
- Server: you need release and config context plus the failing endpoint and inputs.
A practical 10-minute workflow
- Minute 0 to 2: pick one failing request example (not an aggregate chart).
- Minute 2 to 5: classify into a bucket using status code and pattern (who is affected, when it started, where it happens).
- Minute 5 to 10: capture the minimal evidence pack and run the bucket’s fastest confirming check.
Common mistakes that slow down API error triage
These failure modes repeatedly inflate MTTC. Each one has a concrete replacement behavior.
Mistake 1 - Treating all 500s as “backend bug”
Why it slows you down: many 500s are wrappers around upstream failures or timeouts.
Do this instead: ask “is this 500 generated by our app or by a gateway translating an upstream failure?” Confirm with response headers and gateway logs.
Mistake 2 - Debugging from dashboards only
Why it slows you down: aggregates hide the request fingerprint that actually triggers the issue.
Do this instead: always extract one representative failing request and build the evidence pack.
Mistake 3 - Ignoring retries and idempotency
Why it slows you down: retries can turn intermittent issues into floods and can mask the first error.
Do this instead: identify retry layers (client, SDK, gateway) and check whether the endpoint is idempotent. If not, retries can create secondary api errors like duplicate writes or lock contention.
Mistake 4 - Logging secrets or avoiding payloads entirely
Why it slows you down: logging raw payloads can create compliance risk, but logging nothing removes the request fingerprint.
Do this instead: log structured shapes and selectively redact sensitive fields. You need enough structure to reproduce without leaking secrets.
Best practices for diagnosing api errors quickly
These practices are designed to be operational, not aspirational. Each one is a concrete rule you can implement.
1) Standardize error taxonomy and response fields
Even if you cannot fully standardize across services, aim for:
- Stable error codes:
AUTH_EXPIRED,VALIDATION_FAILED,UPSTREAM_TIMEOUT - Correlation IDs: return a request ID header that also appears in server logs
- Consistent envelope:
{ code, message, details }so clients and support can categorize fast
2) Build “fastest confirming checks” into runbooks
For each bucket, write a 5 to 10 minute runbook step that answers one question:
- Client: did the request shape change?
- Auth: are tokens being forwarded and validated as expected?
- Rate limit: which limiter is firing and why now?
- Upstream: which dependency is failing and is it regional?
- Server: what changed at deploy time and which inputs trigger the crash?
3) Prefer structured event records over scattered screenshots
Teams debug faster when each incident has a single, structured record: failing endpoint, environment, reproduction hints, and impact. This is also where tools can help. For example, Flash Log is designed to capture production failures (API, frontend, realtime) at the moment users hit them and package the context into a clean issue record, with sensitive fields redacted, so engineering starts from evidence instead of guesswork.
4) Use external standards for HTTP semantics
If you are aligning behavior, the relevant standards are worth referencing:
- RFC 9110 HTTP Semantics for status code meaning
- RFC 9457 Problem Details for a standard error response format
Checklist - 15 questions to triage API errors fast
Use this checklist in order. It is designed to converge quickly on the correct bucket.
- What is the status code distribution (401/403 vs 429 vs 5xx vs timeouts)?
- Did the spike start at a specific timestamp?
- Did that timestamp match a deploy, config change, or feature flag change?
- Is the issue isolated to one endpoint or many?
- Is it isolated to one tenant, role, API key, or region?
- Do errors correlate with a specific client version or browser?
- Is there a retry layer increasing load?
- Is the gateway returning the error or is the app returning it?
- Is latency rising before error rate rises?
- Are there rate limit headers or Retry-After responses?
- Are auth tokens missing, expired, or failing audience/issuer checks?
- Is there evidence of DNS/TLS/connectivity issues?
- Which upstream dependency correlates with the failures?
- What is one representative failing request fingerprint?
- Do you have the minimal evidence pack captured and shareable?
Related guides
If you are building a faster production debugging workflow, these related guides help you go deeper on specific evidence types:
- stack traces in production and how to find the real failing line faster
| Bucket | Common status codes | Fastest confirming check | What to capture first |
|---|---|---|---|
| Client/request formation | 400, 404, 405, 415, 422 | Compare request fingerprint to API contract | Method, path, content-type, payload shape |
| Auth | 401, 403 | Validate token forwarding and token claims | Auth header presence, issuer, audience, exp |
| Rate limit/quota | 429 | Identify which limiter fired and why | Rate limit headers, identity key, retry pattern |
| Upstream/network | 502, 503, 504, timeouts | Correlate failures to a dependency or region | Dependency name, timeout threshold, region |
| Server application | 500, 503 | Correlate to deploy and isolate triggering inputs | Release tag, endpoint, request fingerprint, saturation signals |
FAQ
How many api errors are actually client-side?
It varies by product, but many teams find a large portion of “new” production errors are request formation issues after a client release: wrong content-type, missing required fields, or calling an outdated path. That is why the first triage step is to capture a request fingerprint and compare it to the contract.
What is the fastest way to tell if a 500 is caused by an upstream dependency?
Check whether the 500 is generated by your app or translated by a gateway, then correlate failures with dependency latency and timeout errors. If the same endpoint fails only when a specific outbound call is slow or failing, classify it as upstream/network first even if the client sees 500.
What should I log to debug api errors without capturing sensitive data?
Log structured metadata: endpoint, method, status, timing, client version, and a redacted payload shape. Avoid raw secrets. A good compromise is to store field names and types, plus a small allowlist of safe fields, while masking known sensitive keys.
When should I stop triage and start deep debugging?
Stop triage when you can state the failing boundary, the top 1 to 2 hypotheses, and the next experiment to confirm. If you cannot reproduce, or if the issue is intermittent, invest next in better evidence capture for one failing request rather than reading code broadly.
If your team wants fewer dead-end investigations, aim to make every incident start with a clean evidence pack and a bucket classification. Flash Log can help by capturing production failures automatically and packaging the endpoint, environment, user path, and impact into a ticket-ready record, so you spend less time reconstructing api errors and more time fixing the right thing.
Unknown Author
Stay in the loop
Weekly tactics to reduce debugging time, automate bug reporting, and ship faster without breaking production.