
Log Correlation for Faster Incident Debugging, a Practical Framework That Works
Production incidents rarely fail in one place. A user clicks “Pay,” the UI spins, an API returns 500, a queue retries, and three services emit logs that look unrelated. Teams often “have logs” but still cannot answer the only question that matters: what exact request path caused the failure and where did it diverge? That gap is what log correlation solves. Done well, it turns scattered lines into one traceable story across services and time, so you can move from alert to root cause without guesswork, Slack archaeology, or endless grepping.
- Log correlation is the practice of linking log events to the same user action or request path using shared identifiers, time windows, and consistent context.
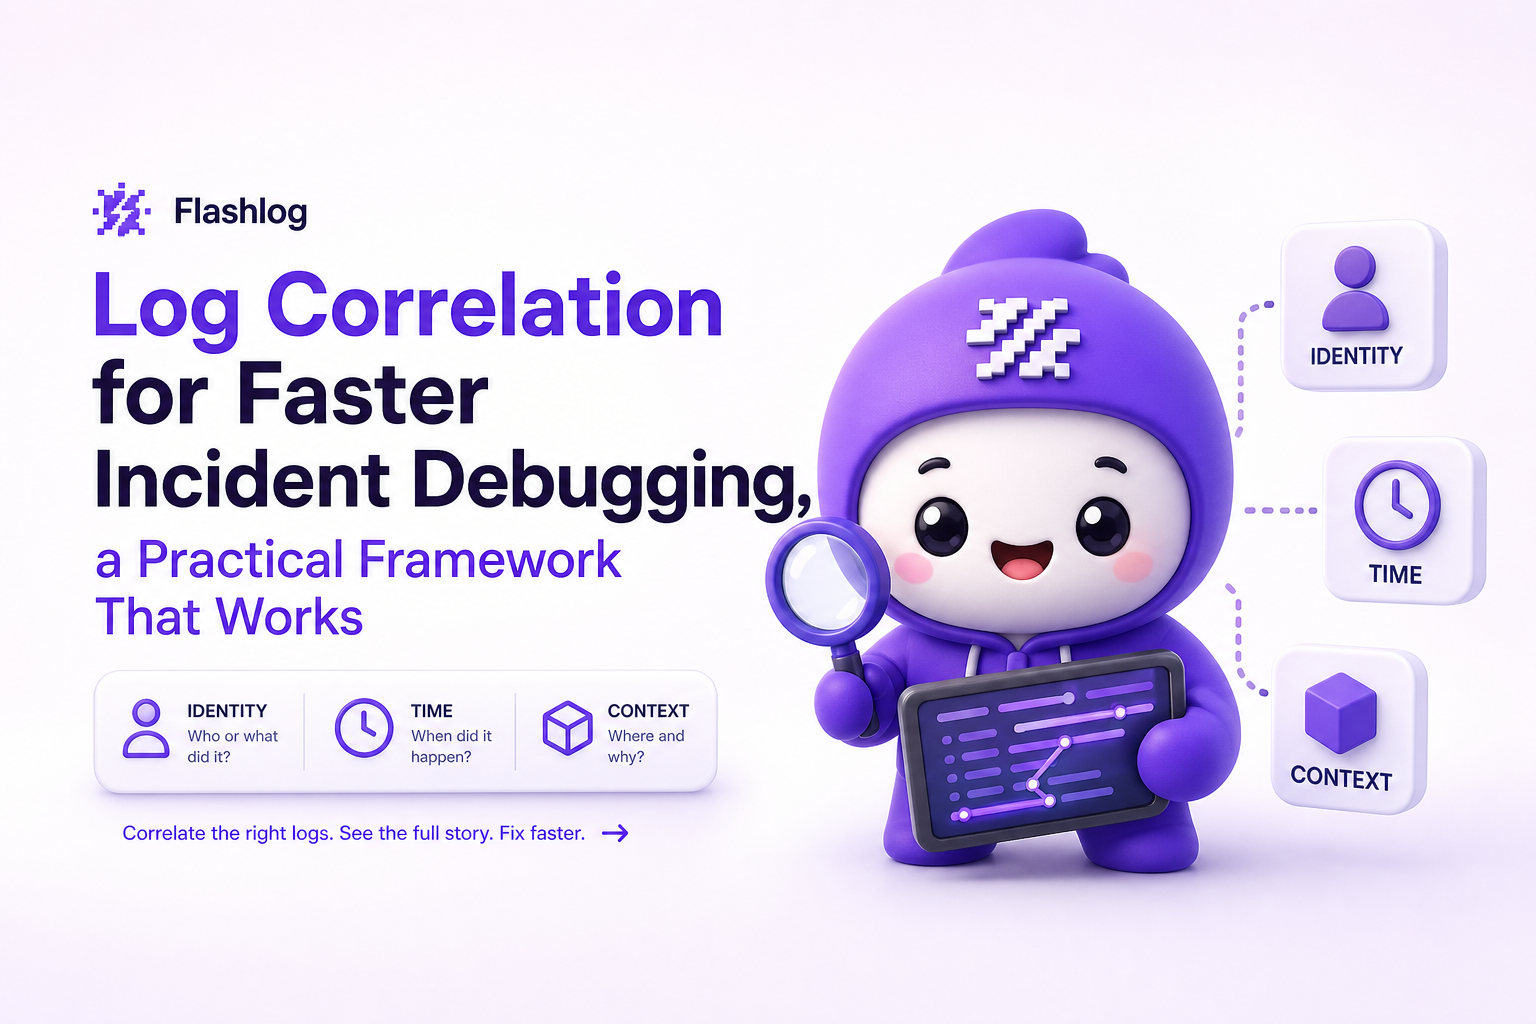
- A production-ready framework uses three anchors: Identity (IDs), Time (bounded windows), and Context (structured fields).
- You can implement it incrementally by standardizing IDs, propagating them end-to-end, structuring logs, and validating during real incidents.
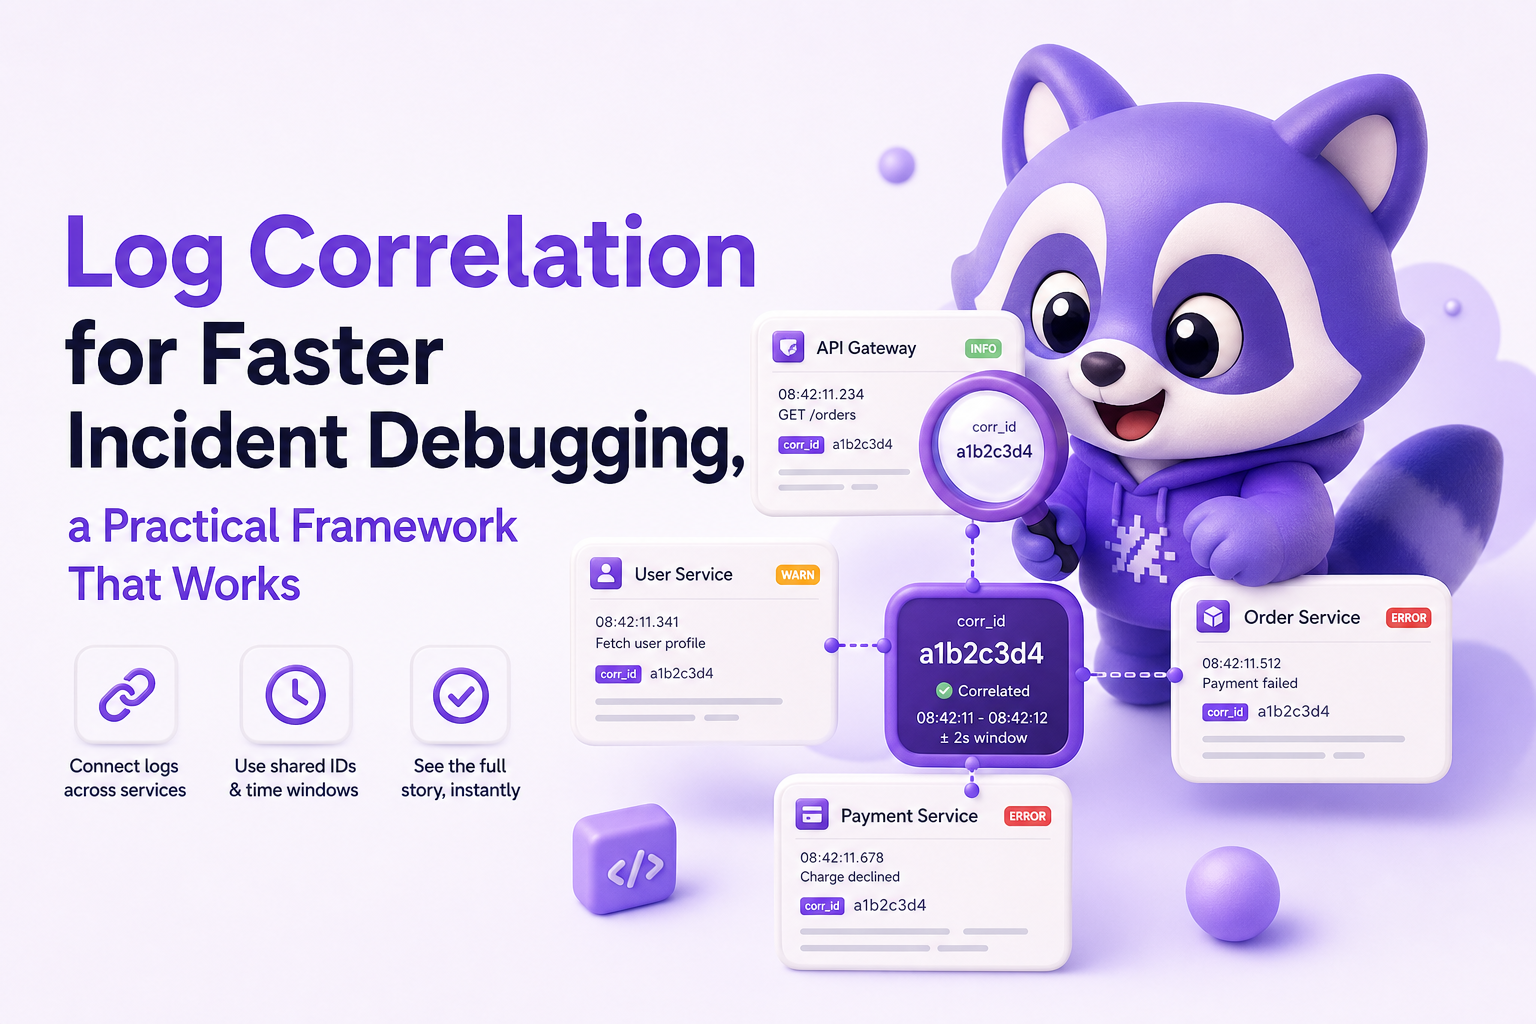
What is log correlation
Log correlation is the method of connecting multiple log events that belong to the same real-world execution path, such as one user checkout, one API request, or one background job, even when those events are spread across different services, hosts, and timestamps.
What it is not
- Not just searching for the same error string. “NullReferenceException” can happen for 20 different reasons across 5 endpoints.
- Not just sorting by time. High traffic makes interleaving inevitable. Two requests can generate identical sequences of logs milliseconds apart.
- Not only tracing. Distributed tracing is great, but many teams still rely on logs for deep context, payload hints, and edge-case visibility. Log correlation makes logs usable at incident speed.
The real debugging goal it serves
In production, the goal is usually one of these:
- Find the first divergence: the earliest point where the “happy path” stopped being true.
- Prove causality: confirm that this database timeout caused that retry storm, not the other way around.
- Bound the blast radius: how many users, which release, which endpoint, which region.
Why grepping fails in real incidents
Grepping fails because production is a concurrency problem. Here is a simple benchmark-style thought experiment:
- Your service handles 500 requests/second.
- Each request generates 10 log lines on average.
- That is 5,000 lines/second per service, before you add dependencies and retries.
If you grep for “checkout” over a 2-minute window, you might pull back hundreds of thousands of lines. Without correlation, you are doing forensic work with no chain of custody.
How it works in production
Log correlation works by making every log line “joinable.” You want to be able to take one symptom (an error line, a failed request, a user report) and reliably pull the full set of related events across the system.
The three correlation anchors
- Identity anchor: a shared identifier that survives hops (request ID, trace ID, order ID, job ID).
- Time anchor: a bounded time window around the failure, using consistent timestamps and clocks.
- Context anchor: structured fields that let you filter and group (service, endpoint, release, user segment, region, status code).
Example workflow from symptom to story
Imagine an alert: “Spike in HTTP 500 on POST /api/checkout.” A correlation-driven workflow looks like this:
- Pick one failing request (from an error log or an APM sample) and extract its
trace_idorrequest_id. - Query logs by that ID across services. You should see a chain like
web→checkout-api→pricing→db. - Expand by time window (for example, ±2 seconds) to catch “nearby” logs that did not carry the ID, like load balancer logs or edge timeouts.
- Use context fields to narrow: filter to
release=2.3.1,region=us-east-1,endpoint=/api/checkout. - Locate the first divergence: the earliest error, timeout, or unexpected branch that explains the 500.
What breaks in real systems (and how to recognize it)
- Identity breaks when IDs are not propagated (missing in async jobs, dropped at gateways, overwritten in proxies). Symptom: you can correlate within one service but not across services.
- Time breaks when clocks drift or timestamps are inconsistent (local time vs UTC, missing milliseconds). Symptom: events look out of order and “cause” appears after “effect.”
- Context breaks when logs are unstructured or fields are inconsistent (
userIdvsuser_id,statusas string in one service and int in another). Symptom: filters miss obvious events and dashboards lie.
Key benefits of log correlation during incidents
Correlation is not about collecting more logs. It is about shrinking time-to-clarity by making the right logs easy to retrieve and trustworthy.
1) Faster root cause isolation with fewer false leads
With log correlation, you can answer “what changed?” using evidence, not hunches. A practical incident benchmark many teams aim for is reducing the “identify failing component” step from 30 to 60 minutes down to under 10 to 15 minutes by jumping directly to the failing request path.
2) Reliable deduplication of repeated failures
When every failure carries a stable identifier (or a consistent fingerprint), you can group 1,000 identical errors into one incident thread. This matters when you are triaging api errors and need to know whether you have one bug or ten.
3) Better handoffs between on-call, backend, and frontend
Instead of “it broke around 10:42,” you hand off: “trace_id=abc123, release=2.3.1, POST /api/checkout, fails after pricing call returns 200 but DB insert times out.” That is actionable. It also makes post-incident reviews more factual.
4) Safer debugging with less sensitive data exposure
Correlation encourages structured logging with explicit fields, which makes it easier to redact or avoid logging secrets. You can keep correlation keys (IDs, hashes) without dumping raw payloads into logs.
Common mistakes that make log correlation fail
Mistake 1: Using only one ID and assuming it covers everything
Teams often rely on a single request_id. That breaks when work continues asynchronously (queues, cron, event buses). Fix: use a small set of IDs with clear semantics:
- trace_id: end-to-end request path (HTTP entry to downstream calls)
- span_id: per-hop unit of work (optional if you do not trace)
- entity_id: business object like
order_idorcheckout_session_idfor “same customer action” grouping
Mistake 2: Not propagating correlation through boundaries
Correlation often disappears at:
- API gateway or load balancer
- Frontend to backend boundary
- Message queues and background jobs
- Third-party webhooks
Checklist to fix propagation:
- HTTP: pass
traceparent(W3C Trace Context) orX-Request-Idboth directions - Queues: include
trace_idin message headers and copy into job context - Webhooks: generate a new
trace_idbut store aparent_event_idto link chains
Reference standard: W3C Trace Context.
Mistake 3: Unstructured logs that cannot be joined
If your log line is a sentence, your query engine cannot reliably filter it. Minimum viable structure for correlation:
timestamp(UTC, with milliseconds)service,env,releasetrace_idorrequest_idrouteorendpointstatus_codeanderror_class(when applicable)
Mistake 4: Correlating by time without fixing clock drift
Time-based correlation is a fallback, not a foundation. If you must use it, make it less fragile:
- Use NTP everywhere and alert on drift
- Log in UTC only
- Include monotonic duration fields like
elapsed_msfor critical steps
Mistake 5: Sampling or dropping the exact logs you need
Sampling is necessary at scale, but naive sampling breaks incident reconstruction. Rules of thumb:
- Never sample errors (4xx/5xx, exceptions, timeouts) unless you have a separate guaranteed error channel.
- Sample success paths but keep enough to reconstruct performance baselines.
- Keep “boundary logs” at ingress, egress, and queue boundaries because they are correlation hubs.
| Correlation anchor | Best for | Common failure mode | Practical fix |
|---|---|---|---|
| Identity (IDs) | End-to-end causality across services | ID not propagated through async boundaries | Standard headers, queue metadata, and consistent logging fields |
| Time (windows) | Edge systems that cannot carry IDs | Clock drift, inconsistent time formats | UTC + NTP + include durations |
| Context (structured fields) | Fast filtering, grouping, dashboards | Unstructured messages, inconsistent field names | JSON logs + schema conventions + linting |
How to implement log correlation without rebuilding your stack
This is an incremental, production-ready rollout plan. You can implement it service by service without a big-bang migration.
Step 1: Pick your correlation IDs and define semantics
Write a one-page “Correlation Contract” your team can follow. Minimum set:
- trace_id: generated at the first entry point (web, API gateway). Format: 16 or 32 hex chars.
- request_id: optional per-service request ID if you want, but do not confuse it with trace_id.
- entity_id: business key for grouping, like
order_id,invoice_id,checkout_session_id.
Step 2: Propagate IDs across HTTP, queues, and realtime
Implementation checklist:
- HTTP clients: automatically attach
traceparentorX-Request-Idon outbound calls. - HTTP servers: read incoming header; if absent, generate; store in request context; include in response headers for debugging.
- Queues: copy trace_id into message metadata; on consumer start, set it into the job context.
- WebSockets/realtime: include trace_id in initial handshake metadata; for messages, include a message_id and optionally a parent_message_id.
Step 3: Standardize structured logs and field names
Adopt JSON logs with a consistent schema. A minimal example:
{
  "timestamp": "2026-06-20T10:42:31.123Z",
  "service": "checkout-api",
  "env": "prod",
  "release": "2.3.1",
  "level": "error",
  "trace_id": "4bf92f3577b34da6a3ce929d0e0e4736",
  "route": "POST /api/checkout",
  "status_code": 500,
  "error_class": "ValidationError",
  "message": "Checkout submit failed"
}
Step 4: Add “boundary logs” to make correlation resilient
Boundary logs are low-volume, high-value events. Add them at:
- Ingress: request received (route, trace_id, release)
- Egress: dependency call start and end (dependency name, duration_ms, result)
- Queue publish and consume (topic/queue, message_id, trace_id)
These logs make it much easier to correlate network failures and timeouts because you can see where the path stalled.
Step 5: Validate correlation during a real incident (not in a demo)
Run a lightweight validation the next time you debug an incident:
- Can you start from one failing log line and retrieve the full chain within 5 minutes?
- Do you see the same trace_id in at least 3 hops (edge → service → dependency)?
- Are the most important fields present: route, release, env, status_code?
- Can you find the relevant stack traces tied to the same trace_id?
If any answer is “no,” you have a concrete fix list. This is how log correlation becomes operational, not aspirational.
A quick incident example using the framework
Symptom: spike of 500s on checkout.
- Identity: pick one error log from checkout-api, extract trace_id.
- Time: expand query ±2 seconds to include gateway and DB logs.
- Context: filter to
release=2.3.1androute=POST /api/checkout.
Result: you find that pricing returns 200, but DB insert duration_ms spikes to 12,000ms, followed by a timeout and a retry storm. Now you can investigate DB connections, slow queries, or a deployment change. This is the practical payoff of log correlation: one coherent story.
FAQ
If you want log correlation outcomes without relying on users to report bugs, Flash Log can capture real production failures (API errors, runtime crashes, and realtime issues), preserve the path into the bug, and package the context so engineers can jump straight to the correlated evidence and create a fixable ticket faster.
Alert Fatigue Explained, A 5-Step Playbook to Cut Noise Without Missing Critical Signals
Reduce alert fatigue with a 5-step playbook, a 60-second self-check, and a scorecard to cut noise without missing critical signals.
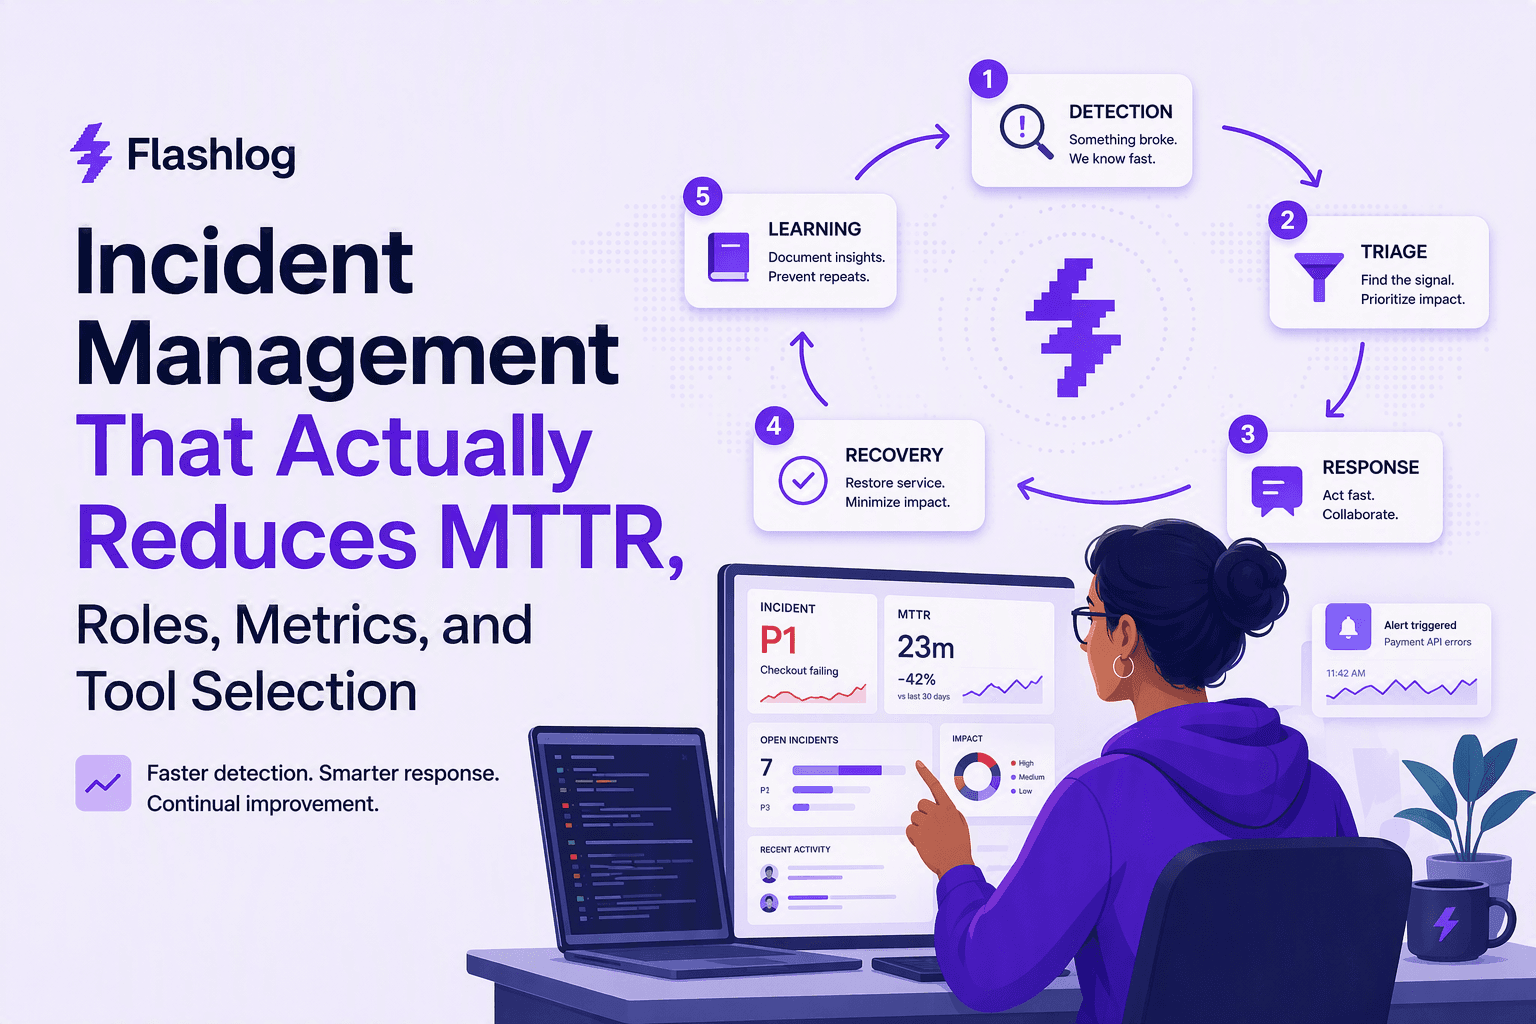
Incident Management That Actually Reduces MTTR, Roles, Metrics, and Tool Selection
A practical incident management playbook: 5-step loop, RACI ownership, MTTR metrics, and tool selection criteria for on-call, ITSM, and AIOps.

CX Genie Reduced Incident Investigation Time by 58% with Flashlog
See how CX Genie used Flashlog to cut incident investigation time by 58%, save 34 engineering hours, and detect issues before customers reported them.