
Network Failures in Production Explained Through a Simple 4-Layer Triage Flow
When network failures hit production, the symptom is often the same: “it times out” or “it works for me.” Meanwhile, customers see blank pages, stuck checkouts, or reconnect loops, and your team burns hours chasing noisy logs. The hardest part is that many incidents are intermittent, region-specific, or only happen on certain devices and networks, which makes the usual debugging playbook feel unreliable. This guide gives you a production-first workflow to isolate the failing layer quickly, even when signals are incomplete. You will learn what counts as a network issue (and what does not), a 4-layer triage flow from fastest checks to deep dives, and how to prove root cause and prevent repeats.
- Classify symptoms by layer (DNS, TCP/TLS, routing, L7) before you change anything, so you do not “fix” the wrong problem.
- Use targeted experiments (known-good resolvers, curl with SNI, traceroute, synthetic checks) to turn intermittent failures into reproducible evidence.
- Validate the fix with a rollback-ready checklist and guardrails (timeouts, retries, circuit breakers, and monitoring) to reduce repeat incidents.
What are network failures in production
In production, “network” is often used as a catch-all for any request that did not succeed. That is a mistake. A useful definition is:
Network failures are errors where the client cannot reliably establish, maintain, or complete communication with the intended service endpoint, due to issues in name resolution, connection setup, routing, or transport security, before your application logic can respond normally.
What counts as a network failure (with common symptoms)
- DNS failures: NXDOMAIN, SERVFAIL, long lookup times, different answers by region, “could not resolve host.”
- TCP connection failures: connection refused, connection timed out, SYN retries, intermittent resets.
- TLS handshake failures: certificate verify failed, handshake timeout, SNI mismatch, “wrong version number.”
- Routing and path issues: packet loss, sudden latency spikes, one region failing, asymmetric routing, blackholes.
- Application-layer (L7) failures that look like network: 502/503/504 from a proxy, upstream timeouts, WebSocket close codes due to upstream overload.
What does not count (but is commonly mislabeled)
- Expected 4xx like 401/403/422, unless they are caused by a proxy or auth edge misrouting. Many teams confuse these with connectivity issues. For a practical way to triage these quickly, see api errors.
- Application exceptions that happen after the request is received, like null dereferences or serialization errors. Those are not network failures, even if the UI shows “Something went wrong.” If you need to pinpoint the failing line fast, review stack traces.
- Slow database queries that cause timeouts at the edge. The symptom is a timeout, but the root cause is server-side latency. You still use the same 4-layer flow below to prove it is not the network first.
A quick symptom-to-layer map you can use in incident chat
| Observed symptom | Most likely layer | Fastest confirming test | Common false positive |
|---|---|---|---|
| “Could not resolve host”, NXDOMAIN, SERVFAIL | DNS | dig +trace and query a known public resolver | Local DNS cache or split-horizon DNS |
| Connection timed out (no HTTP status) | Routing or firewall | mtr or traceroute, check security group/NACL changes | Server overloaded and not accepting connections |
| Connection refused | TCP/listener | nc -vz host port, verify service is listening | Wrong port or stale DNS to an old IP |
| TLS handshake failed, cert errors | TLS | openssl s_client -servername to validate SNI and chain | Clock skew on client devices |
| 502/503 from CDN or reverse proxy | L7 upstream | Check proxy logs and upstream health checks | Edge configuration deploy |
| 504 gateway timeout | L7 timeout budget | Compare upstream latency percentiles vs proxy timeout | Packet loss causing retransmits |
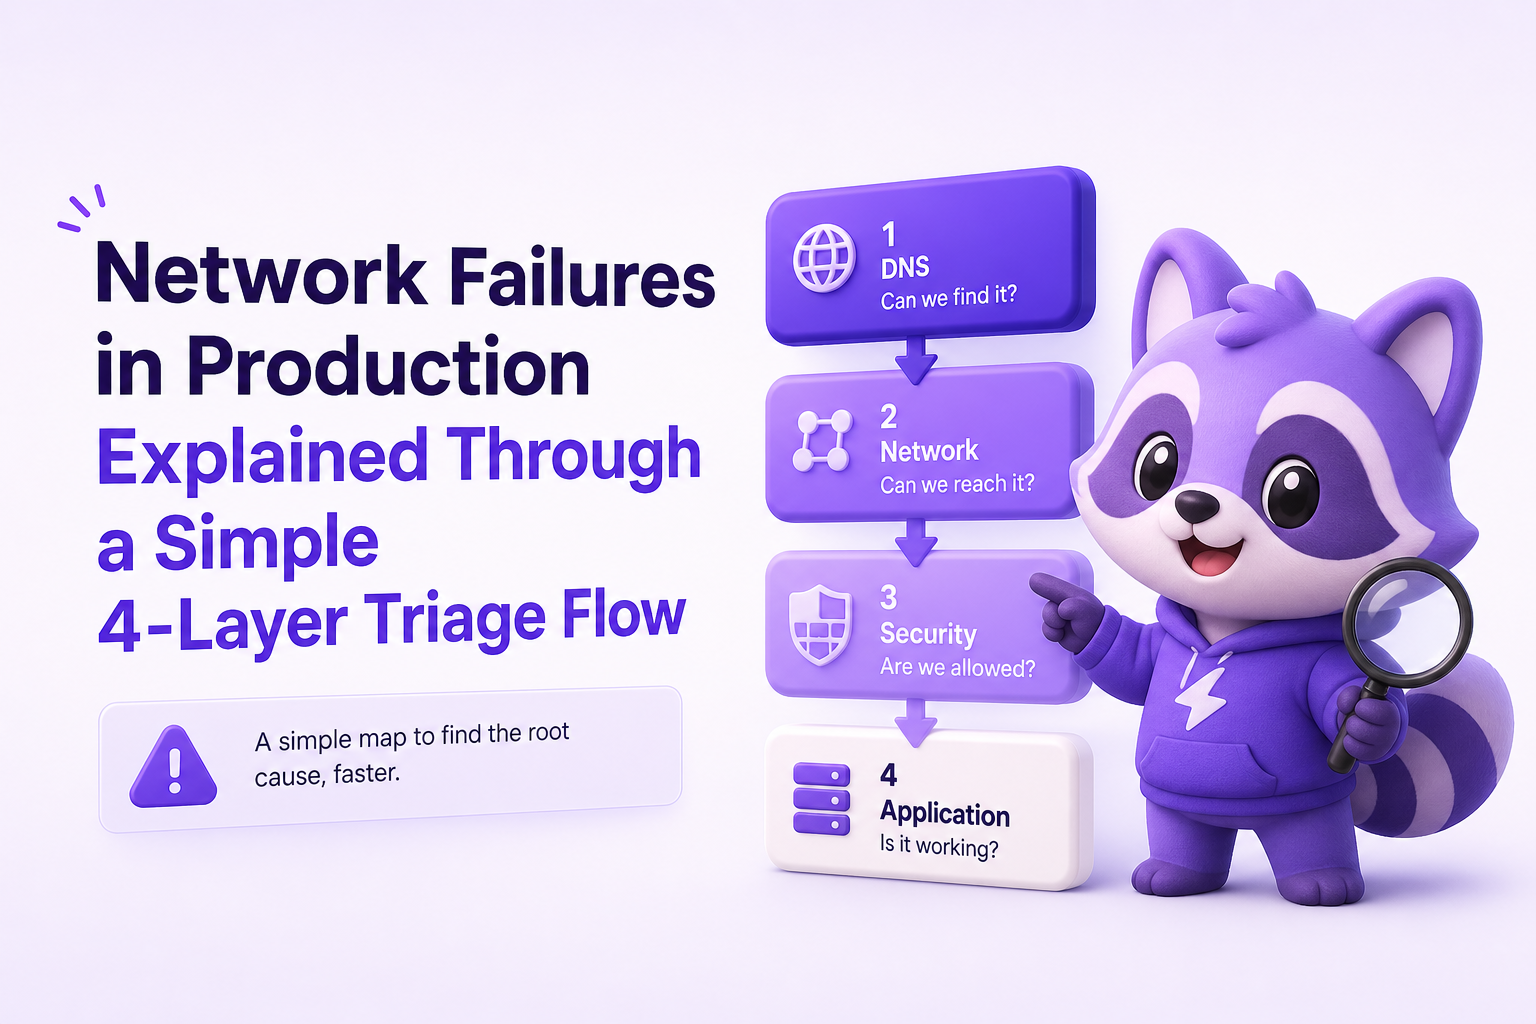
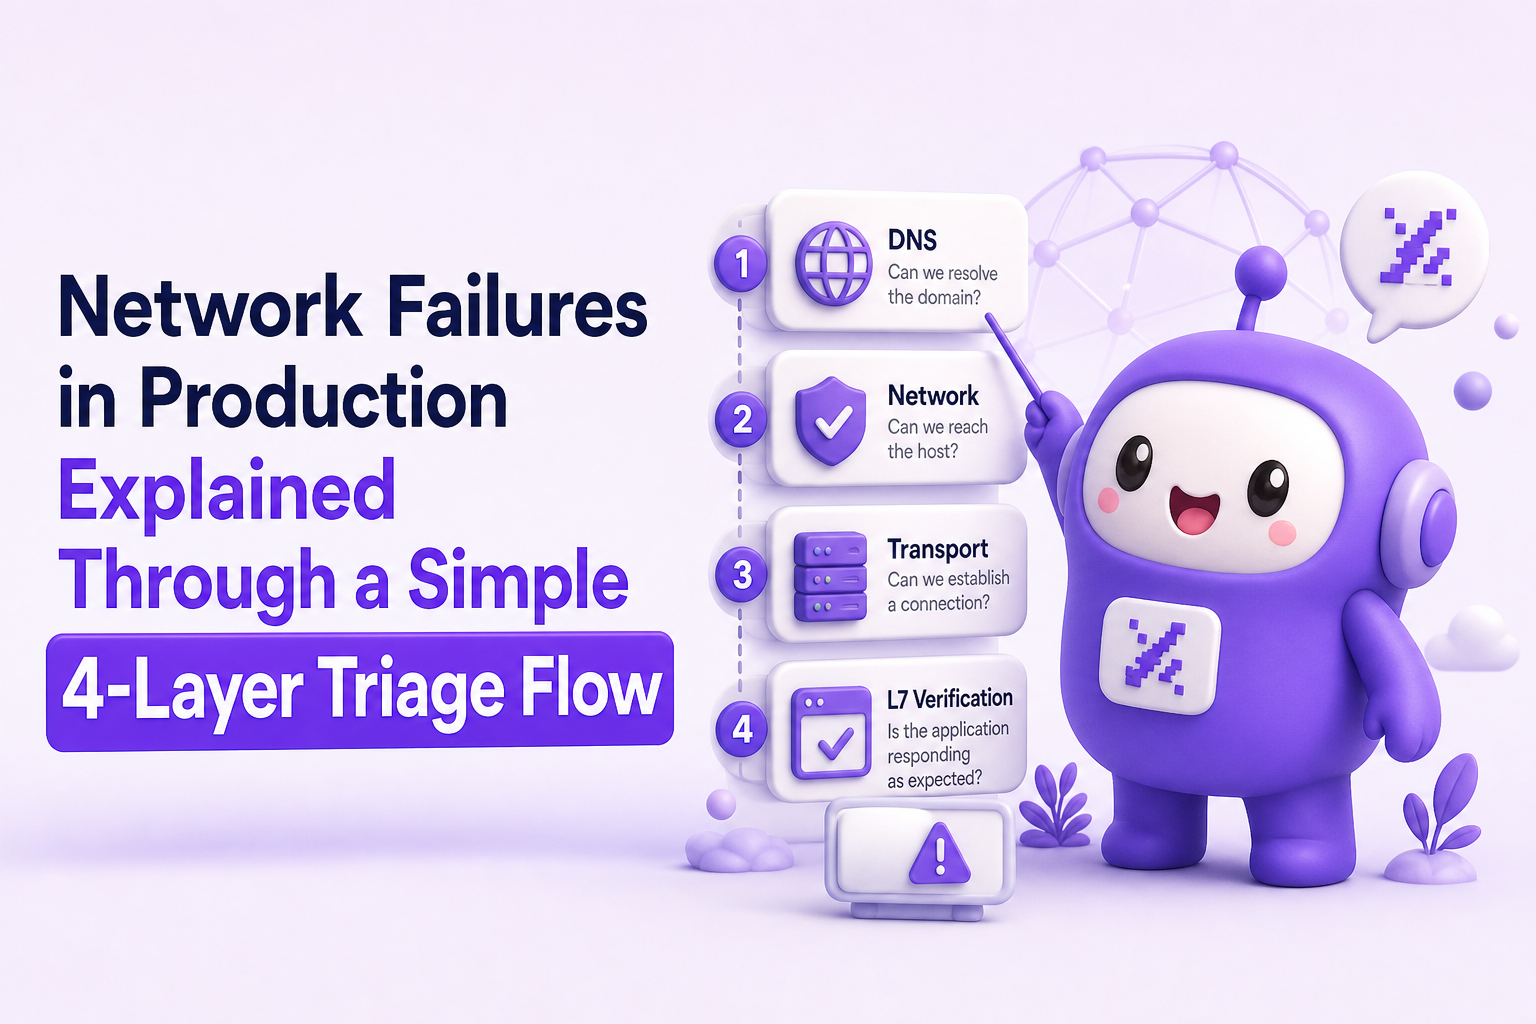
How it works: a 4-layer triage flow for network failures
This flow is designed to reduce time-to-isolation. You start with the cheapest checks that eliminate whole classes of causes, then you go deeper only when evidence forces you to. The output of each layer is a binary decision: “this layer is healthy” or “this layer is suspect,” plus a short artifact you can paste into the incident channel.
Layer 1: DNS and service discovery
DNS issues create region-specific and ISP-specific failures, and they often look intermittent because caches mask them. Start here when the symptom is “cannot reach host,” sudden spikes in errors after a deploy, or only some users are affected.
Checklist
- Confirm the hostname and record type: A/AAAA/CNAME, and whether IPv6 is in play.
- Compare answers from multiple resolvers: your VPC resolver, Cloudflare (1.1.1.1), Google (8.8.8.8).
- Check TTL and propagation: low TTL can amplify resolver load; high TTL can keep stale IPs alive.
- Look for split-horizon DNS: internal vs external answers differ.
Fast commands (copy/paste)
dig your.api.example.com Adig @1.1.1.1 your.api.example.comdig +trace your.api.example.comnslookup your.api.example.com 8.8.8.8
Decision criteria
- DNS is suspect if different resolvers return different IPs unexpectedly,
SERVFAILappears, or lookup time is consistently high (for example, p95 DNS lookup above 200 to 300 ms for a frequently called hostname is a red flag). - DNS is likely healthy if resolution is fast, consistent across resolvers, and matches your expected targets.
Layer 2: TCP connectivity and TLS handshake
If DNS looks good, move to connection establishment. Many production network failures live here: firewalls, security groups, misconfigured load balancers, expired certificates, or SNI mismatches after a domain change.
Checklist
- Is the port reachable from the affected network or region?
- Are you seeing timeouts vs refusals? Timeouts suggest path or filtering; refusals suggest no listener or wrong target.
- Does TLS succeed with the correct SNI?
- Are client clocks sane? Mobile devices with incorrect time can fail cert validation.
Fast commands
nc -vz your.api.example.com 443curl -v https://your.api.example.com/healthopenssl s_client -connect your.api.example.com:443 -servername your.api.example.com -showcerts
Decision criteria
- TCP is suspect if you cannot complete a TCP handshake from multiple vantage points, or failures correlate with a specific region or ASN.
- TLS is suspect if TCP connects but handshake fails, cert chain is incomplete, SNI returns a default certificate, or handshake timeouts appear after a CDN or load balancer change.
Layer 3: Routing, packet loss, and regional path issues
Routing problems are why incidents feel “random.” A subset of users take a broken path due to ISP routing, BGP changes, or a provider edge issue. This is where you prove whether the path is unhealthy or whether the problem is actually upstream saturation.
Checklist
- Confirm the blast radius: one region, one ISP, one mobile carrier, or global?
- Measure loss and latency over time: a single traceroute is not enough.
- Compare multiple vantage points: at least one inside your cloud region and one outside.
- Check recent network changes: NACLs, security group rules, route tables, VPN/peering changes.
Tools and commands
mtr -rwzbc 100 your.api.example.com(captures loss and latency distribution)traceroute your.api.example.com(quick path snapshot)- Synthetic monitoring from multiple regions (for example, a simple HTTPS check every 30 to 60 seconds from 3 to 5 regions)
Decision criteria
- Routing is suspect if you see sustained packet loss (for example, 1 to 2 percent can already break real-time and cause retries to explode) or a sharp latency jump that aligns with the affected geography.
- Routing is less likely if loss is near zero and latency is stable, but you still see 502/504. That pushes you to L7.
Layer 4: L7 verification (HTTP, proxies, timeouts, retries)
Many “network” incidents are actually L7 budget problems: the request reaches your edge, but upstream services are slow, overloaded, or returning errors. Users experience it as network failures because the browser shows “failed to fetch” or a generic timeout.
Checklist
- Differentiate status codes: 502/503/504 vs 500 vs no response.
- Inspect proxy and load balancer metrics: upstream connect time, upstream response time, error rates.
- Validate timeout budgets end-to-end: client timeout, CDN timeout, load balancer timeout, app server timeout.
- Check retry behavior: aggressive retries can amplify load and turn slowness into an outage.
A concrete example: 504s that are not a network problem
Suppose your CDN returns 504 for POST /api/checkout. DNS and TLS look healthy. Traces show upstream p95 latency jumped from 300 ms to 8 s after a release. The CDN timeout is 5 s. Users see a timeout and report “the network is down,” but the fix is to roll back the release or optimize the slow dependency, not to tweak DNS.
Key benefits of a layered approach to network failures
The main win is speed, but the real benefit is correctness. A layered approach prevents “fixes” that only hide symptoms.
1) Faster time-to-isolation with binary decisions
Each layer produces a clear pass/fail outcome. That reduces debate and helps you assign the next action to the right owner (platform, networking, backend, edge).
2) Better incident communication with evidence artifacts
Instead of “it times out,” you can paste an artifact like: “DNS answers differ between 1.1.1.1 and VPC resolver” or “TLS handshake fails only without SNI.” This is especially helpful when network failures are intermittent.
3) Reduced rollback thrash
Teams often roll back blindly when users complain. With the 4-layer flow, you can set rollback criteria, such as: “if Layer 1 to 3 are clean and L7 p95 latency regresses 10x after release, roll back.”
4) Cleaner monitoring and alert design
Once you know which layer failed, you can add the right checks: DNS resolution time, TLS handshake success rate, regional packet loss, or upstream timeout ratios. That prevents future network failures from being detected only by customer reports.
Common mistakes when debugging network failures
Mistake 1: Treating “timeout” as a single root cause
A timeout can be DNS, TCP, TLS, routing, or L7 budget exhaustion. Fixing the wrong layer wastes time and can create new risks, like disabling TLS verification.
Mistake 2: Testing only from a developer laptop
Many network failures are region- or ISP-specific. Always test from at least two vantage points: one inside your cloud region and one outside, ideally from the affected geography.
Mistake 3: Ignoring retries and client behavior
Retries can multiply load during partial outages. A 2 percent failure rate with retries can quickly become a self-inflicted incident. Audit retry counts, jitter, and total timeout budgets.
Mistake 4: Over-indexing on a single log stream
Edge logs may show 504s, app logs may show nothing, and users see “failed to fetch.” That mismatch is normal. You need correlated evidence: request IDs, upstream timing, and client-side error context.
Mistake 5: Declaring victory without a validation experiment
If you change a firewall rule or roll back a release, prove it. Watch the same metric that detected the incident for at least one full deploy cycle, and re-run the failing command from the affected vantage point.
Proving the root cause and preventing repeat incidents
Run targeted experiments that isolate one variable
- DNS experiment: temporarily query a known-good resolver in a canary client, or validate authoritative answers with
dig +trace. - TLS experiment: test with and without SNI; validate certificate chain and expiry; confirm intermediate certs are served.
- Routing experiment: compare MTR from two regions; if only one is failing, capture hop-level loss and timestamps for your provider ticket.
- L7 experiment: hit a minimal
/healthendpoint vs the failing endpoint; if health is fine but checkout fails, the network is probably fine and the dependency path is not.
Use rollback criteria tied to user impact
Define rollback triggers before the next incident. Example criteria:
- Error budget trigger: if 5xx or timeouts exceed 1 percent for 5 minutes on a revenue-critical route, roll back.
- Regional trigger: if one region exceeds 5 percent failures and you cannot mitigate via traffic shifting within 10 minutes, roll back or fail over.
- Handshake trigger: if TLS handshake failures spike after a cert or CDN change, revert immediately and re-issue with correct chain.
Add guardrails that reduce future network failures
- Timeout budgets: set explicit connect and read timeouts, and keep them consistent across clients and proxies.
- Retry discipline: cap retries, add jitter, and avoid retrying non-idempotent requests unless you have idempotency keys.
- Circuit breakers: fail fast when dependencies are unhealthy to avoid cascading timeouts.
- Regional synthetic checks: a simple HTTPS probe from multiple regions can catch DNS and routing issues before users do.
Capture enough context to reproduce intermittent failures
Intermittent network failures are hard because the evidence disappears. The minimum useful context for each failure is:
- Timestamp and region (or approximate geography)
- Hostname, resolved IP, port, protocol
- Error class (DNS vs connect vs TLS vs HTTP status)
- Request path and method (for L7)
- Client environment (browser, OS, app version)
If your logs are noisy or users do not report issues, tools like Flash Log can help by capturing production failures at the moment they happen and packaging the technical trail (endpoint, environment, and the failing step) into one issue that engineers can act on without chasing screenshots.
| Layer | Primary signal to monitor | Good baseline (rule of thumb) | What to alert on |
|---|---|---|---|
| DNS | DNS lookup p95 | < 100 to 200 ms for frequent hosts | p95 spike + NXDOMAIN/SERVFAIL increase |
| TCP | Connect success rate | > 99.9% | Timeouts or refused connections spike |
| TLS | Handshake success rate | > 99.9% | Cert verify failures, handshake timeouts |
| L7 | Upstream response time p95 | Stable within 2x normal | 502/503/504 increase, upstream timeout ratio |
FAQ
How do I tell if it is DNS or the server is down?
If DNS fails (NXDOMAIN, SERVFAIL, long lookup), you will not reliably get an IP to connect to. If DNS is fast and consistent but connects fail or HTTP returns errors, DNS is likely fine. Confirm by querying two resolvers and comparing answers.
Why do network failures affect only some users or one region?
Caches, ISP routing, and regional edges create different paths to your service. A broken route, a partial CDN outage, or a resolver issue can impact only certain geographies, carriers, or ASNs.
What is the fastest way to debug TLS handshake failures?
Use openssl s_client -connect host:443 -servername host to validate SNI, certificate chain, and expiry. If TCP connects but TLS fails, focus on cert chain, SNI, and client clock skew.
Are 502 and 504 network failures?
They are often L7 upstream failures that feel like network failures to users. A 502 usually means the proxy got a bad response from upstream; a 504 means the proxy timed out waiting. Use upstream timing metrics to confirm.
If you want to reduce the time it takes to go from “users are seeing network failures” to “here is the exact failing request, environment, and reproduction path,” consider using Flash Log to capture production failures automatically and turn them into a clean, ticket-ready issue your engineering team can fix faster.
Unknown Author
Stay in the loop
Weekly tactics to reduce debugging time, automate bug reporting, and ship faster without breaking production.