
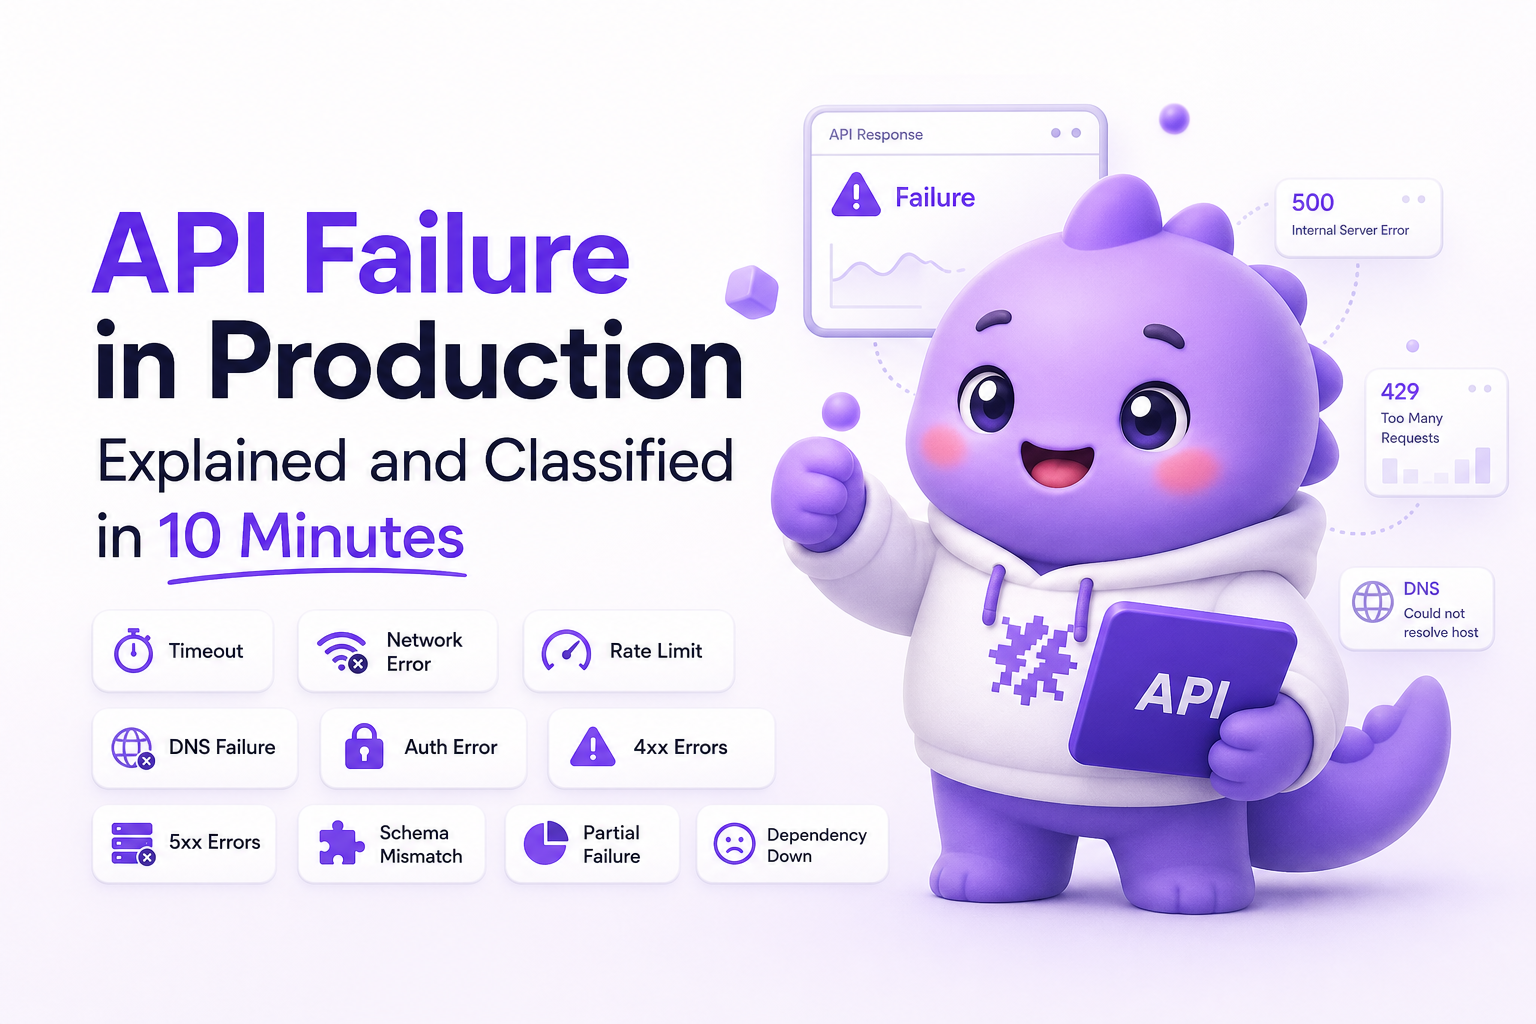
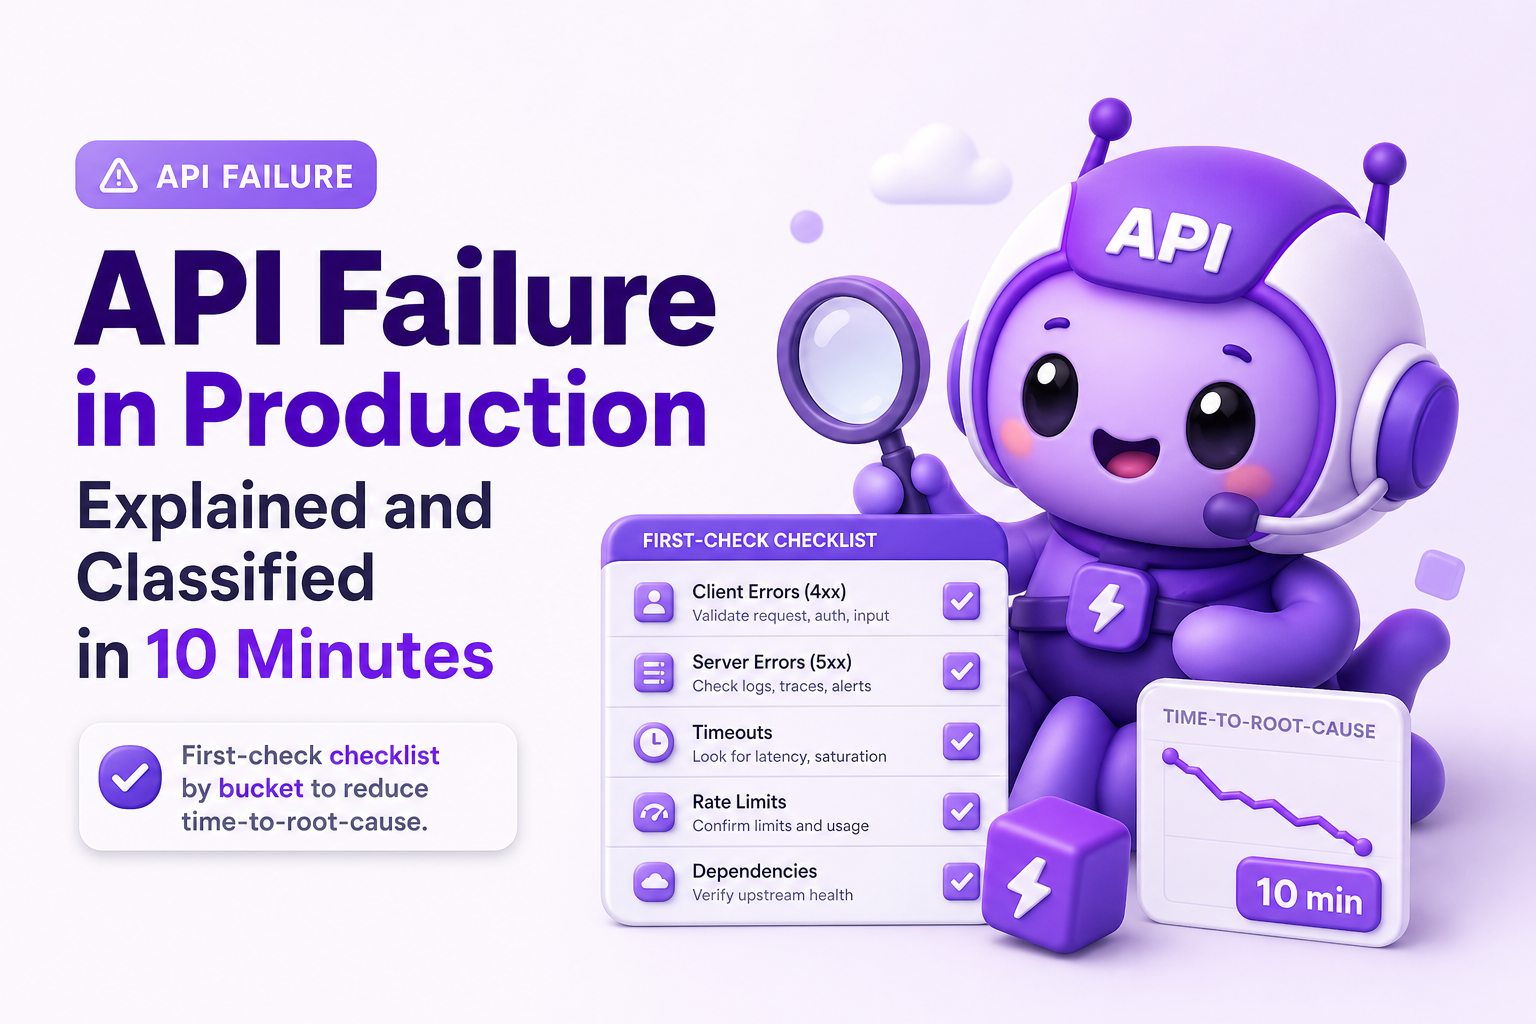
API Failure in Production Explained and Classified in 10 Minutes
An api failure in production rarely shows up as a clean “500 error and done.” More often, it looks like a checkout that spins forever, a mobile app that silently retries, a websocket that disconnects only on one ISP, or a “works on my machine” incident that only happens after a deploy. The cost is not just downtime, it is time lost to misclassification: teams chase the wrong layer, pull the wrong logs, and ask users for screenshots instead of isolating the failing request path. This guide defines what counts as an API failure beyond HTTP codes, then gives you a fast, repeatable way to classify the failure in minutes so you can choose the right next debugging move.
- An api failure includes contract, dependency, capacity, and code-path breakdowns, not just HTTP 5xx responses.
- A 4-bucket triage can classify most production failures in under 10 minutes using a few concrete signals.
- Each bucket has a “check first” list that reduces time-to-root-cause by avoiding the wrong logs and the wrong hypotheses.
What is an api failure in production
An api failure is any situation where a client (browser, mobile app, backend service, partner integration) cannot successfully complete an intended API interaction within the expected contract. “Success” is broader than an HTTP 200. It includes correct status codes, correct response shape, acceptable latency, and correct side effects (for example, an order is actually created).
What counts as an API failure beyond 500s
- Contract failures: the request or response no longer matches what the client expects. Examples: missing fields, renamed JSON keys, wrong content-type, invalid enum values, schema drift.
- Dependency failures: your API is up, but a downstream system is not. Examples: payment provider timeout, database failover, cache stampede, third-party rate limiting.
- Capacity failures: the system is overloaded or constrained. Examples: queue backlog, thread pool saturation, connection exhaustion, CPU throttling, memory pressure leading to GC storms.
- Code-path failures: a specific branch or handler is broken. Examples: null dereference, unhandled exception, missing route after deploy, feature-flagged path not tested, permission check bug.
Common symptoms teams mislabel
These symptoms are frequently reported as “API is down,” but they map to different root causes:
- Infinite spinner: could be a client-side timeout, CORS preflight failure, or a backend request that never completes.
- Intermittent 401/403: often a token refresh race, clock skew, or a permission regression in one endpoint.
- Sudden spike in 400s: frequently a contract change shipped by one side only, or stricter validation in a new release.
- “Only affects some users”: can indicate geo routing, CDN edge issues, ISP-specific packet loss, or a rollout that split traffic by cohort.
A practical definition you can use in incident triage
Use this definition in production: An API interaction has failed if the client cannot complete the intended action with the expected response shape and latency, given valid inputs, in the current release. This forces you to check three things early: validity of inputs, release context, and whether the failure is shape, latency, or correctness.
How it works a 4-bucket triage to classify any api failure in 10 minutes
The goal of this triage is not to find the root cause instantly. It is to classify the failure correctly so the next 30 minutes of debugging are spent in the right place. You can run it with four inputs: (1) one failing request example, (2) timestamp, (3) user or cohort, and (4) release version.
The 10-minute classification flow
- Confirm the failure mode (2 minutes): Is it wrong status, wrong shape, wrong latency, or wrong side effect?
- Check blast radius (2 minutes): One user, one cohort, one region, or global? Only after a deploy?
- Inspect the first hard signal (3 minutes): one of logs, metrics, traces, or a captured failing request.
- Place it into one bucket (3 minutes): Contract, Dependency, Capacity, or Code-path.
Bucket definitions with quick decision criteria
- Contract: 4xx spikes, validation errors, deserialization errors, client parsing errors, or response fields missing or changed. Often correlated with a client or server release.
- Dependency: increased latency, timeouts, 502/503/504, circuit breaker opens, errors from a specific downstream. Often correlated with one provider or one internal service.
- Capacity: p95 and p99 latency climb, queue depth grows, saturation metrics spike, errors rise with traffic. Often time-of-day correlated.
- Code-path: consistent 500s on one endpoint or one feature path, stack traces, “route not found,” or exceptions introduced in the latest deploy.
A simple classifier table you can paste into your runbook
| What you see first | Most likely bucket | Fastest next check | What to avoid doing first |
|---|---|---|---|
| 400/422 spike after release | Contract | Compare request/response schema between versions | Scaling infra or tuning DB |
| 504 timeouts, upstream errors | Dependency | Downstream latency and error rate by dependency | Refactoring handler code without evidence |
| Latency climbs with traffic, CPU high | Capacity | Saturation metrics, queue depth, connection pools | Blaming a third-party immediately |
| 500s on a single endpoint, reproducible | Code-path | Server logs and stack traces for the handler | Adding retries on the client |
Key benefits of classifying an api failure before you debug
Classification sounds like process, but it produces concrete engineering wins. Here are the benefits that show up in real incident timelines.
1) Faster selection of the right evidence
If you call everything a “500,” you default to server logs. But contract failures often need request payload diffs, dependency failures need downstream metrics, and capacity failures need saturation and queue signals. A correct bucket tells you whether to start with logs, metrics, traces, or a captured request.
2) Less thrash between teams
Misclassified incidents create ping-pong: frontend blames backend, backend blames infra, infra blames the provider. The 4-bucket model gives a shared vocabulary: “This looks like dependency because we see 504s and downstream p95 tripled.” That is actionable and falsifiable.
3) Better user communication and mitigations
Mitigation differs by bucket:
- Contract: rollback the breaking change, add backward compatibility, or loosen validation temporarily.
- Dependency: fail open, degrade gracefully, switch provider, or adjust timeouts and circuit breakers.
- Capacity: shed load, add concurrency limits, scale, or reduce expensive queries.
- Code-path: hotfix, rollback, or disable the feature flag.
4) Cleaner post-incident fixes
When the bucket is correct, the follow-up work is more specific: schema contracts and versioning for contract issues, resilience patterns for dependency issues, capacity modeling for load issues, and tests plus rollout controls for code-path issues.
What to check first in each bucket to reduce time-to-root-cause
This section is a set of first checks designed to be fast. Each list is ordered so you can stop as soon as you have a strong lead. If you need supporting concepts on related production symptoms, see the guides on api errors and network failures.
Bucket A Contract failure checks
- Check for release correlation: Did the client or server deploy within the last 1 to 2 hours? Contract breaks often align tightly with a rollout window.
- Look at 4xx distribution by endpoint: One endpoint spiking suggests a specific schema/validator change.
- Capture one failing request and response: Confirm content-type, required fields, and response shape. If you have an API schema, validate against it.
- Search logs for validation/deserialization errors: Examples include “cannot unmarshal,” “missing required property,” “invalid enum,” “unexpected token.”
- Compare old vs new payloads: If mobile is affected but web is not, compare app versions and payload shape.
Fast mitigation: add backward compatible parsing, accept both field names temporarily, or roll back the breaking change. If you use JSON Schema or OpenAPI, enforce it in CI and publish versioned changes.
Bucket B Dependency failure checks
- Identify the likely downstream: Map the failing endpoint to its dependencies (DB, cache, payments, email, search).
- Check downstream latency and error rate: Look for a step-function increase at the same timestamp.
- Look for timeouts and circuit breaker events: A rise in timeouts often precedes 5xx.
- Confirm rate limits: Many providers return 429 or custom error codes. Check headers like
Retry-Afterwhere applicable. - Validate DNS and TLS errors if it is intermittent: Especially for region-specific failures.
Fast mitigation: degrade functionality, increase cache usage, switch to a fallback provider, or narrow the scope of calls. For HTTP semantics and status code meaning, reference RFC 9110.
Bucket C Capacity failure checks
- Confirm traffic and concurrency change: Compare RPS, concurrent requests, and queue depth to baseline.
- Check saturation signals: CPU, memory, GC time, thread pool utilization, DB connections, open file descriptors.
- Check p95 and p99 latency per endpoint: Capacity issues often show a long-tail latency blow-up before error rates spike.
- Look for hot keys and thundering herds: Cache miss spikes, stampedes after cache expiry, or a single tenant overloading shared resources.
- Validate autoscaling and limits: Ensure scaling policies are triggered and not blocked by quotas.
Fast mitigation: shed load (return 429 with backoff), add rate limits, temporarily disable expensive features, or scale up. Longer term, add capacity tests and set SLO-based alerting on latency and saturation.
Bucket D Code-path failure checks
- Check deploy and config changes: A code-path api failure often begins immediately after a release, feature flag flip, or config update.
- Find the top exception signature: Group by exception type and failing endpoint to avoid chasing noise.
- Reproduce with the smallest input: Reduce to one request that consistently fails. If it only fails for specific users, compare their payload fields and permissions.
- Inspect the handler boundaries: Input validation, auth, database write, and external calls. Determine which step throws first.
- Verify routing and environment: Missing routes, wrong base URL, or environment variables can create “works in staging” mismatches.
Fast mitigation: rollback, disable the feature flag, or hotfix the handler. Then add regression tests for the failing branch and improve rollout safety (canary, gradual traffic, automated checks).
Common mistakes that keep api failures hard to debug
These are not abstract anti-patterns. Each one maps to a specific delay you can measure in incident timelines.
1) Treating status codes as the whole story
A 200 response can still be an api failure if the response body is missing fields, contains wrong values, or the side effect did not occur. Add checks for “correctness” signals, not just availability.
2) Debugging without a single concrete failing example
Teams often start with dashboards, then hunt for the exact request later. Invert that. Get one failing request with timestamp, endpoint, status, and release. Without it, you cannot reliably correlate logs, traces, and metrics.
3) Not separating retries from real failures
Retries can hide the true failure mode. A client might retry three times and succeed, while users still experience a 6 to 10 second delay. Track both initial failure rate and final success rate, and alert on latency regressions.
4) Mixing expected business errors with production bugs
Some 4xx responses are correct outcomes (for example, invalid coupon). If they are logged and escalated like incidents, you drown in noise and miss real api failure signals. Tag expected errors and keep them out of incident channels unless they spike unexpectedly.
5) Losing the path into the failure
Knowing the endpoint is not enough. You need the user actions and navigation path that led to it, especially for multi-step flows like onboarding, checkout, or permissions changes. Without the path, reproduction becomes guesswork and time-to-root-cause stretches.
FAQ
Is an api failure always a server-side problem?
No. An api failure can be caused by client contract mismatches, network issues, authentication flows, or downstream dependencies. Classification helps you avoid assuming “backend bug” by default.
How do I tell contract failure vs code-path failure quickly?
If 4xx errors spike and logs show validation or parsing problems, it is usually contract. If you see consistent 5xx or exceptions in one handler after a deploy, it is usually code-path.
What metrics should I look at first for capacity-related api failure?
Start with p95 and p99 latency by endpoint, then saturation metrics like CPU, memory, thread pool usage, DB connections, and queue depth. Capacity issues often show long-tail latency before hard errors.
What is the fastest way to reduce time-to-root-cause during an incident?
Get one concrete failing request example with timestamp and release version, then place it into one of the four buckets. That single step prevents wasted time pulling irrelevant logs and arguing about ownership.
If you want this triage to be easier in real production conditions, Flash Log can help by capturing failures at the moment users hit them, preserving the path into the bug, and packaging the technical context so the next debugging move is obvious instead of speculative.
Unknown Author
Stay in the loop
Weekly tactics to reduce debugging time, automate bug reporting, and ship faster without breaking production.