
Stack Trace Meaning Explained So You Can Spot the Real Error Faster
You open an error report, see 40 lines of cryptic file paths and function names, and still cannot tell what actually broke. That confusion is exactly why understanding stack trace meaning matters: it turns a scary wall of text into a map of what code ran, in what order, and where it failed. In production and in local dev, the fastest debuggers are not the ones who know every framework detail. They are the ones who can reliably extract the failing line, the trigger, and the relevant context from a trace without guessing. This guide gives you a simple method to read stack traces quickly, plus the most common patterns that mislead teams and how to handle them.
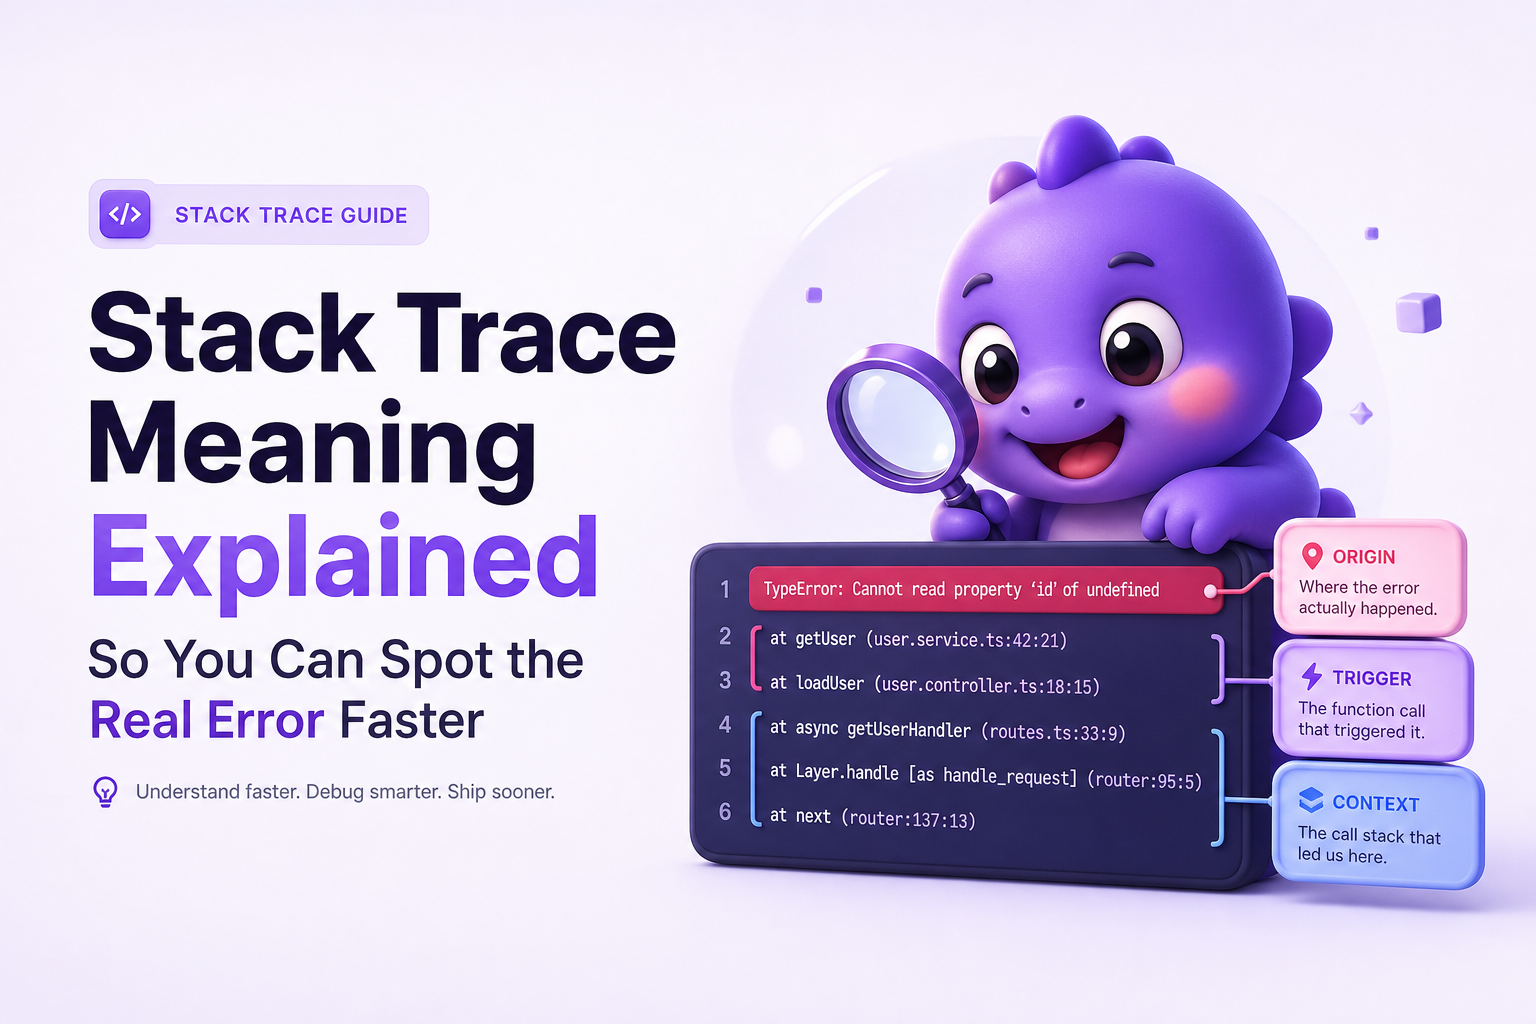
- A stack trace is a snapshot of the call stack at the moment an error occurred, showing the chain of function calls (frames) that led to failure.
- Use a repeatable 3-part method: find the origin (where it failed), the trigger (who called it), and the context (inputs, request, user action, environment).
- Most time is lost to “noise frames” from frameworks, async boundaries, and wrappers; learn to filter them with a quick checklist.
What is stack trace meaning
Plain-English definition
A stack trace is a printed list of the function calls your program was in the middle of executing when an error happened. Each line is a frame, typically showing:
- Function or method name (what code was running)
- File and line number (where it was defined or called)
- Module/package (which library it came from)
The core stack trace meaning is: “Here is the path the program took to reach the failure.” If you can identify the first relevant frame in your code, you can usually fix the bug faster than by reading the whole trace.
Call stack vs stack trace vs frames
- Call stack: the in-memory stack of active function calls right now.
- Stack trace: the human-readable dump of that stack at a moment in time (usually when an exception is thrown).
- Frame: one entry in that stack, representing a function invocation and where it came from.
Why stack traces often look “backwards”
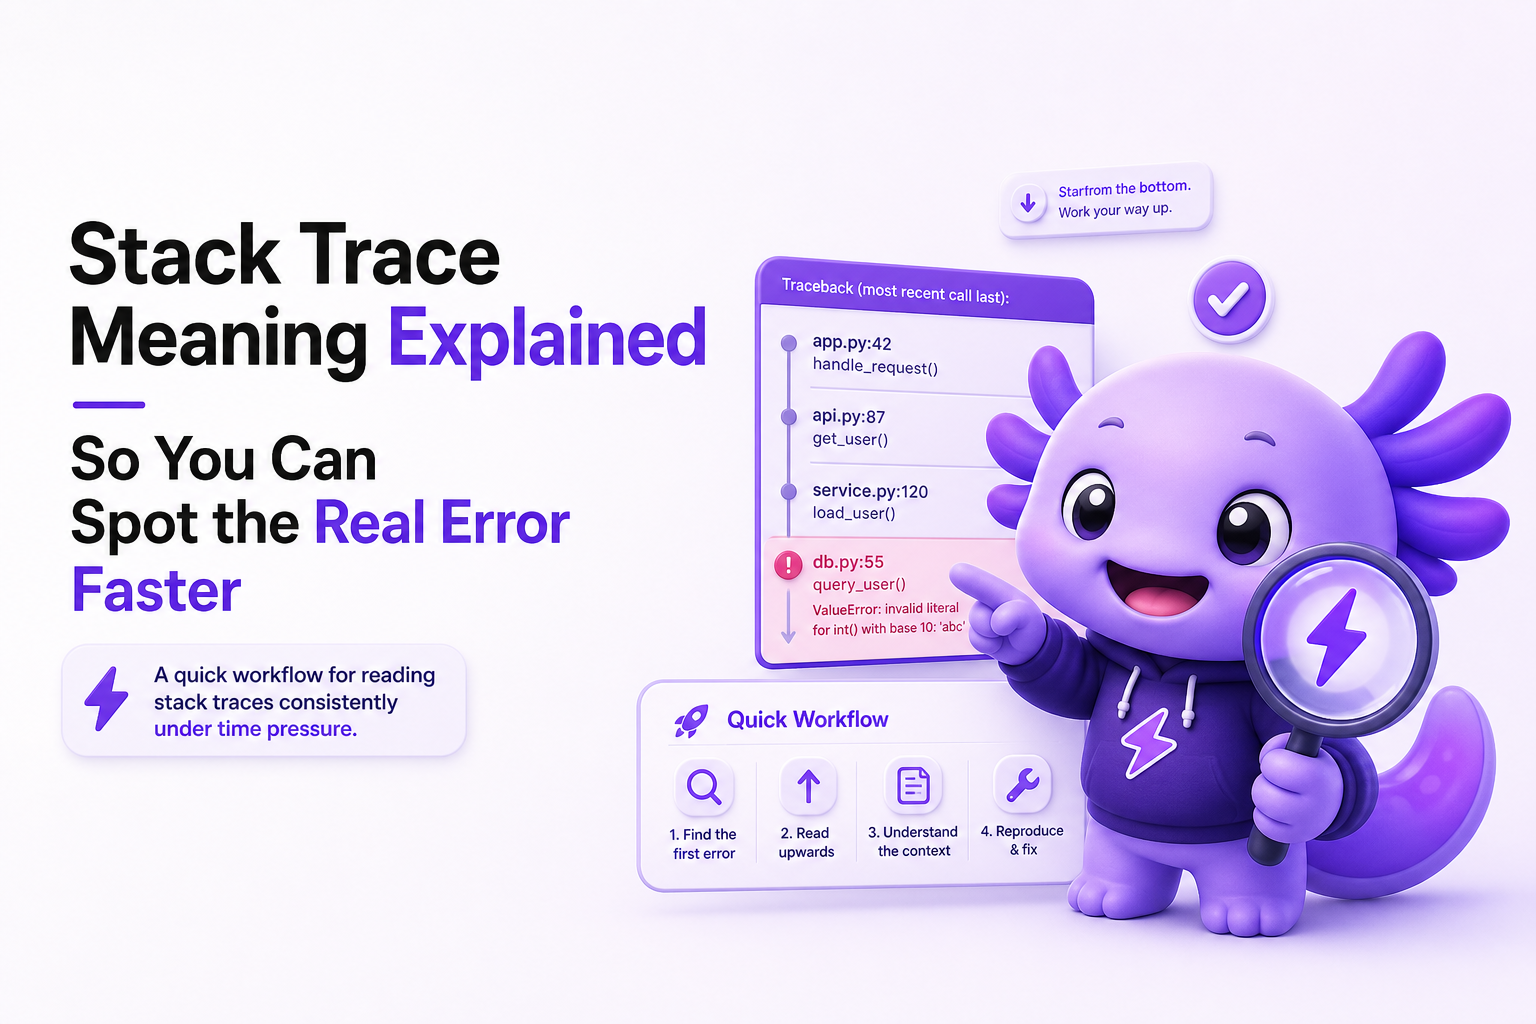
Many runtimes print the most recent call first. That means the top of the trace is closest to the crash site (the immediate failure), while the bottom shows earlier calls that eventually led there (the deeper history). This is why developers argue about reading “top-to-bottom vs bottom-to-top.” The right answer is: do both, but for different questions.
How it works from error to trace
What happens when an exception is thrown
- Your program executes functions, pushing frames onto the call stack.
- An error occurs (for example, null reference, type error, failed assertion).
- The runtime creates an exception object and captures stack information.
- If the exception is unhandled, the runtime prints/logs the stack trace and terminates the current flow (or the process, depending on environment).
A small example you can “read”
Imagine a simplified JavaScript error:
TypeError: Cannot read properties of undefined (reading 'price')
    at calculateTotal (pricing.js:42:17)
    at onSubmitCheckout (checkout.js:88:9)
    at HTMLButtonElement.handleClick (ui.js:15:5)
How to interpret it:
- Origin (where it failed):
calculateTotalinpricing.js:42. - Trigger (who called it):
onSubmitCheckoutincheckout.js:88. - Context (what user did): click handler in
ui.js:15suggests a button click, likely “Submit checkout.”
This is the practical stack trace meaning you want in your head: the trace is a chain, and you are hunting for the first actionable link in your code.
Why production traces can be harder than local traces
- Minified or bundled code: line numbers may refer to compiled output unless source maps are available.
- Missing symbols: native crashes or stripped binaries can hide function names.
- Async boundaries: the “logical” call chain gets split across tasks, promises, threads, or event loops.
If you want more depth on how stack traces behave in real deployments, see stack traces.
How to read a stack trace without guessing
The 3-part method: origin, trigger, context
When engineers get stuck, it is usually because they read every line equally. Use this repeatable method instead. It works across languages because it focuses on intent, not syntax. The goal is to translate stack trace meaning into three answers you can act on.
- Origin: the first frame that shows the actual failure point (often near the top).
- Trigger: the nearest caller in your code that led into the origin (often a few frames below).
- Context: the request, user action, job, message, or input that caused the trigger to run.
Step-by-step checklist (fast triage)
- Step 1: Identify the exception type and message (first line). Example:
NullPointerException,TypeError,IndexError. This tells you what kind of mistake to look for. - Step 2: Find the first “your code” frame. Scan from the top until you hit your namespace, repo path, or service module.
- Step 3: Mark that as the origin candidate. Open that file and line. Confirm it matches the error (for example, the line actually dereferences a null).
- Step 4: Find the trigger frame. Continue downward until you see the caller that passed the bad input or chose the wrong branch.
- Step 5: Capture context. Look for request IDs, endpoint names, job names, user actions, or parameters that correlate with the trigger.
Top-to-bottom vs bottom-to-top, when each is correct
- Read top-to-bottom when you want the origin quickly. The top is usually closest to where the exception was thrown.
- Read bottom-to-top when you need the story of how execution got there, especially for user flows and event-driven code.
In practice: start at the top to locate the failing line, then jump down to find where your app code first enters the trace, then work upward or downward as needed. This is the fastest way to apply stack trace meaning under time pressure.
A quick decision table for “what to open first”
| If you see... | Most likely | Open first | What to verify |
|---|---|---|---|
| A clear file:line in your repo near the top | Real bug in your code at that line | The topmost app frame | Does the line match the exception type? |
| Only framework frames at the top | Your code is deeper or wrapped | First frame with your module path | Who passed bad data into the framework call? |
| Async/task boundary messages | Logical caller is separated | Origin frame plus related logs/trace IDs | Can you correlate to the triggering request/job? |
| Minified bundle references | Missing source maps or wrong build | Release build config | Are source maps uploaded and matched to release? |
Key benefits of understanding stack trace meaning
1) Faster “time to first actionable line”
Most debugging time is lost before anyone even opens the right file. If you can consistently pick the correct origin frame in under 2 minutes, you reduce back-and-forth and avoid random code spelunking. The benefit of stack trace meaning is not academic. It is operational: fewer dead ends.
2) Better bug reports and handoffs
A useful handoff includes the exception, the origin frame, and the trigger frame, plus minimal context. Instead of “it crashed,” you can write:
- Error: TypeError reading
price - Origin:
pricing.js:42incalculateTotal - Trigger:
checkout.js:88on submit - Context: happens after selecting a discount code
This format makes your report reproducible, which is the real point of reading traces well.
3) Less time blaming the wrong layer
Teams often blame the database, the network, or “the framework” because those frames dominate the trace. A correct read keeps you honest: if the first app frame shows a bad assumption, fix that first. If the trace points to a failing outbound request, switch to investigating api errors or network failures with the right evidence.
4) Clearer prioritization of fixes
Once you can identify origin and trigger reliably, you can also categorize the failure quickly:
- Input validation gap (bad or missing data)
- State bug (unexpected null/undefined, race condition)
- Dependency failure (timeout, 500, rate limit)
- Release/config mismatch (wrong environment variables, missing migrations)
That categorization helps decide whether to hotfix, roll back, or investigate deeper.
Common mistakes that make teams misread stack traces
Mistake 1: Stopping at the first line that looks familiar
Some traces start with generic runtime helpers or a framework dispatcher. If you stop there, you “fix” the wrong thing. Rule: the origin is the first frame that is both (a) close to the exception and (b) in code you can change. If the top frames are unchangeable, keep scanning.
Mistake 2: Treating framework frames as noise 100% of the time
Framework frames are often noise, but sometimes they contain the clue that explains the trigger, such as a route name, middleware, controller action, or serializer. Fix: keep one framework frame above and below your first app frame in your notes. That small window often reveals how the request was shaped.
Mistake 3: Losing the logical call chain at async boundaries
Async code can break the neat “A called B called C” story. Symptoms include frames mentioning tasks, promises, event loops, or worker pools. Fix: correlate with IDs and timestamps. In web systems, that usually means request ID, trace ID, user ID, release version, and endpoint. If the error involves an outbound call, treat it as a potential api failure and gather the request and response metadata.
Mistake 4: Ignoring source maps and symbols until it is too late
If your trace points into a minified bundle or shows unknown for function names, you can waste hours. Fix: add a release checklist item:
- Source maps uploaded for the exact build artifact
- Build IDs or commit SHAs included in error reports
- Symbol files uploaded for native apps (if applicable)
This is not optional hygiene. It directly affects whether stack trace meaning is usable at all.
Mistake 5: Confusing “where it crashed” with “why it crashed”
The origin frame answers where. The trigger and context usually answer why. Fix: do not propose a fix until you can state both in one sentence, for example:
Where: calculateTotal crashed reading price. Why: checkout submit passed an item without a populated price after applying a discount code.
FAQ
What is the simplest stack trace meaning to remember?
A stack trace is the list of function calls that were active when an error happened. It tells you the path execution took to reach the failure, usually with file names and line numbers.
Should I read a stack trace from the top or the bottom?
Start at the top to find the origin (closest to the failure), then read downward to find the trigger and context. Bottom-to-top is useful when you need the full story of how the program reached that point.
How do I find the “real” failing line if the trace is full of framework code?
Scan from the top until you hit the first frame in your repo or service namespace. That is usually the first actionable origin candidate. Keep one framework frame around it for routing or middleware clues.
Why does my production stack trace not match my source code?
Common causes are minification/bundling without correct source maps, deploying a different build than you are viewing locally, or missing symbols for native code. Ensure release identifiers and source maps/symbols are uploaded for the exact artifact.
If you want stack traces and surrounding context captured automatically when real users hit failures, Flash Log records the failure trail (request, environment, and user path), groups duplicates, and turns it into a cleaner issue you can act on without chasing screenshots.
Unknown Author
Stay in the loop
Weekly tactics to reduce debugging time, automate bug reporting, and ship faster without breaking production.