
False Positives Explained, Why They Happen and How to Reduce Alert Noise
False positives are one of the fastest ways to turn a monitoring, security, or QA system into background noise: the tool says “something is wrong,” but the world is actually fine. Once enough false positives hit Slack, email, or a ticket queue, teams stop trusting alerts, and real incidents slip through.
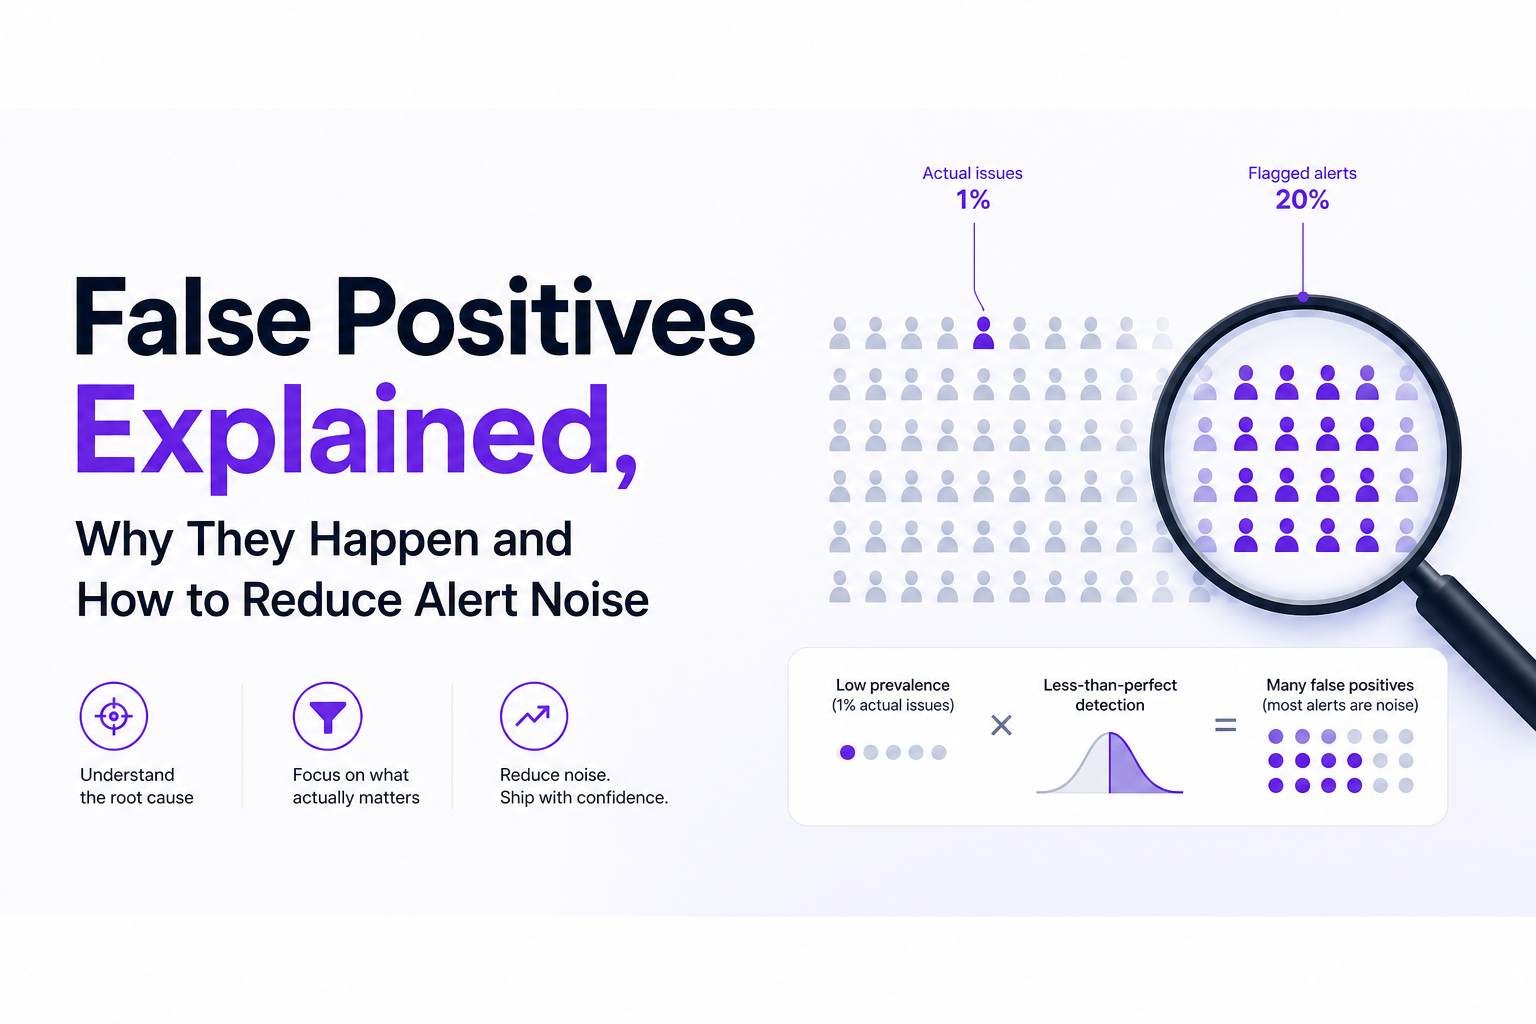
- False positives are “false alarms” and they are often driven by base rates: even a good detector can produce mostly false alerts when true issues are rare.
- Teams commonly mix up FPR (false positive rate) with precision (PPV), which leads to bad threshold and staffing decisions.
- You can reduce false positives without “turning down sensitivity” by adding correlation, allowlists/ignore rules, confirmatory checks, and calibrated thresholds.

False positives explained in plain English
A false positive happens when a system flags a problem that is not actually a problem. It is the classic “false alarm.” In contrast, a false negative happens when a real problem exists but the system fails to flag it.
False positives vs false negatives in one sentence each
- False positive: The alert fires, but nothing actionable is wrong.
- False negative: Something actionable is wrong, but no alert fires.
Don’t confuse “false positives” with “false positivity”
In some contexts, “false positivity” refers to forced optimism or toxic positivity. Here, we are strictly talking about detection and classification errors that create alert noise.
Why false positives turn into alert noise
Alert noise is not just “too many messages.” It is unreliable messaging. If an on-call engineer sees 30 alerts and 27 are false positives, the brain learns that alerts are usually ignorable. That behavioral conditioning is the real damage: the next true incident gets triaged like spam.
The confusion matrix and the metrics people mix up
If your team debates thresholds, severity rules, or “how good” a detector is, you need one shared table. Everything else is vocabulary drift.
The 2x2 table that grounds the conversation
| Actual issue: Yes | Actual issue: No | |
|---|---|---|
| Alert: Yes | True Positive (TP) | False Positive (FP) |
| Alert: No | False Negative (FN) | True Negative (TN) |
Four metrics that get mixed up (and why it matters)
- False Positive Rate (FPR): FP / (FP + TN). “Out of all the truly normal cases, how often do we falsely alert?”
- False Negative Rate (FNR): FN / (FN + TP). “Out of all the truly bad cases, how often do we miss them?”
- Precision (PPV): TP / (TP + FP). “When we alert, how often is it real?”
- False Discovery Rate (FDR): FP / (TP + FP) = 1 - precision. “When we alert, how often is it wrong?”
The common mistake: treating FPR like “how noisy alerts are”
FPR is about normal events. Engineers and stakeholders usually care about: “If an alert fires, what is the chance it is real?” That is precision (or its inverse, FDR). Low FPR can still produce terrible precision if true issues are rare.
After running multiple alert audits, the pattern was clear: teams that reported “our FPR is only 1%” were still drowning in false positives because they were operating in a low-prevalence environment where 1% of a huge number is still a lot.
Why false positives happen so often even with “good” tests
The core idea is the base rate (prevalence): how often real issues happen compared to normal behavior. In production systems, real incidents are typically rare relative to the total volume of requests, sessions, log events, or auth attempts. That rarity is what makes false positives feel inevitable.
One numeric example that clarifies FPR vs precision
Assume a detector that looks “good” on paper:
- Prevalence of real issues: 1% (1 in 100 events is truly bad)
- Sensitivity (true positive rate): 90% (so FNR = 10%)
- Specificity: 99% (so FPR = 1%)
Now apply it to 10,000 events:
- Actual issues: 1% of 10,000 = 100
- Actual normal: 9,900
- True positives: 90% of 100 = 90
- False negatives: 10% of 100 = 10
- False positives: 1% of 9,900 = 99
What the team experiences
The alert stream contains TP + FP = 90 + 99 = 189 alerts, and 99 of them are false positives. Precision is 90 / 189 = 47.6%. In other words, even with a 1% FPR, more than half of your alerts can be false alarms when the base rate is low.
How to use this example operationally
Before you argue about “accuracy,” ask two questions:
- What is the base rate? For this alert type, what fraction of events are truly actionable?
- Which metric matches the pain? If the pain is alert fatigue, track precision (or FDR), not only FPR.
False positives in AI and cybersecurity, what they look like in real life
False positives show up differently across domains, but the confusion matrix is always the same. The fastest way to debug noise is to map a real alert to TP/FP/FN/TN and then ask what upstream assumption created the FP.
Machine learning classification example
Scenario: A model flags customer support tickets as “high urgency bug” to route to engineering.
- TP: It flags a ticket that truly describes a reproducible product defect.
- FP (false positives): It flags “how do I reset my password?” as a bug, creating a noisy engineering handoff.
- FN: It misses a real regression report buried in a long message thread.
In our experience working with teams that auto-route issues, the highest-leverage fix is not “a better model” first, it is tightening the definition of “actionable” and labeling borderline cases consistently so the model learns your operational standard.
Cybersecurity alert example
Scenario: An IDS flags “possible data exfiltration” when a host uploads large files.
- TP: Unusual outbound transfer to an untrusted destination at odd hours.
- FP (false positives): Legitimate backup jobs, patch downloads, or CI artifacts moved to a known storage bucket.
- FN: Slow exfiltration spread over time (low and slow) that stays under a static threshold.
Production monitoring example
Scenario: A “checkout failure” alert triggers on any non-200 response.
- TP: A 500 error on POST /api/checkout that blocks purchase completion.
- FP (false positives): Expected payment declines (issuer declines, insufficient funds), validation errors, or rate limits that are normal business outcomes.
If you want a deeper workflow view of how noisy errors become work, the article on runtime exceptions breaks down why “everything looks urgent” once it hits the backlog.
How to reduce false positives without missing real issues
“Turn down sensitivity” is the blunt instrument. It often reduces false positives by increasing false negatives, which is how teams end up quiet but blind. A better approach is to keep detection sensitive, then add decision layers that raise precision.
A 5-step operational playbook
- Define “actionable” in writing (per alert type). Include: user impact, revenue impact, security impact, and whether engineering can fix it. This prevents expected business outcomes from being mislabeled as incidents.
- Measure precision weekly, not just volume. Track TP and FP for each rule/model. If you cannot label everything, sample 30 alerts per week per category and estimate precision with confidence intervals.
- Add correlation before notification. Require at least two independent signals: error spike + conversion drop, or IDS anomaly + new process + unusual destination. Correlation is a precision multiplier.
- Use allowlists and ignore rules for known-benign patterns. Examples: specific endpoints, status codes, or flows that are expected (payment declines, validation failures, known 404s from optional assets). This directly targets recurring false positives.
- Introduce confirmatory checks. Re-check after 60 to 120 seconds, attempt a synthetic transaction, or validate with a second data source. Many false alarms are transient or measurement artifacts.
Thresholding that does not backfire
If you must change thresholds, do it with a trade-off table. For each candidate threshold, estimate:
- Expected alerts per day
- Estimated precision (PPV)
- Estimated miss rate (FNR) for high-severity incidents
What surprised our team was how often a small amount of hysteresis (different trigger vs clear thresholds) reduced false positives from oscillation without increasing false negatives for real incidents.
Calibration and labels for AI-driven alerts
If an AI model outputs a probability, calibration matters. A “0.9” score should mean “about 90% of these are truly positive” over time. If it does not, you will see false positives cluster at the top of the queue. A practical approach is to calibrate with a holdout set (Platt scaling or isotonic regression) and then pick thresholds based on target precision.
When the problem is workflow, not detection
Sometimes the detector is fine, but the routing is wrong: every event becomes a ticket or a page. In those cases, insert a triage step that classifies expected failures, duplicates, and low-confidence signals before they reach humans. If you are building that process, this guide to issue triage is a useful framework for deciding what deserves engineering attention.
A starter checklist for cutting alert noise this week
This is a lightweight plan you can run in 5 business days. The goal is measurable reduction in false positives while keeping high-severity detection intact.
Day 1: Inventory and sampling
- List top 10 alert types by volume (pages, Slack alerts, tickets).
- For each type, sample 20 to 50 recent alerts and label them TP or FP.
- Compute precision = TP / (TP + FP) per alert type.
Day 2: Classify the false positives by cause
- Expected business outcomes: declines, validation failures, permission denials.
- Duplicates: one bug creating hundreds of identical alerts.
- Low-context signals: stack traces without user impact, one-off anomalies.
- Instrumentation artifacts: deploy spikes, timeouts from synthetic probes, cron noise.
Day 3: Apply two precision multipliers
- Add ignore rules or allowlists for the top 3 recurring expected patterns.
- Add correlation for one high-volume alert (pair it with a second signal).
Day 4: Add a confirmatory check for the noisiest page
- Require persistence: alert must be true for N out of M minutes.
- Or run a synthetic transaction before paging.
Day 5: Re-measure and set a maintenance cadence
- Re-sample 20 to 50 alerts per type and re-calculate precision.
- Set a weekly 30-minute review: top false positives, new ignore rules, and one correlation improvement.
For teams that debug live issues, pairing reduced noise with better context is the unlock. If your alerts lack surrounding evidence, investing in log correlation can raise precision by making “real” look different from “random.”
| Problem pattern | What it looks like | Best fix | Metric to watch |
|---|---|---|---|
| Expected outcomes flagged | Declines, validation errors, known 404s create tickets | Allowlist/ignore rules by endpoint, status, flow | Precision (PPV) |
| Duplicate storms | One bug produces 100 alerts | Fingerprinting, grouping, dedupe | Alerts per incident |
| Single-signal paging | Any spike pages on-call | Correlation with second signal | FDR (false discovery rate) |
| Flappy thresholds | Alert triggers and clears repeatedly | Hysteresis, persistence windows | Pages per day |
FAQ
If you want a practical way to keep false positives from becoming noisy tickets and alerts, Flash Log adds a decision layer that filters expected failures, groups duplicates, and holds back low-confidence signals before they hit Jira, Linear, or Slack, so engineering sees fewer interruptions and more actionable issues.

Website Session Replay Explained With a Real Example and a Setup Checklist
Learn website session replay basics, a real bug-to-fix walkthrough, and a privacy-safe setup checklist for collecting and using replay data.

Escalation Policy Template And Matrix For On-Call Teams
Use a practical escalation policy template and SEV matrix with timelines, roles, and targets to reduce missed pages and time-to-ack.

Issue Triage for Production Bugs - A 10-Minute Framework to Find Signal Fast
Learn a 10-minute issue triage framework to prioritize production bugs, scope impact, and capture the right evidence fast.