
Crash Reporting That Engineers Actually Use, A Workflow for Turning Crashes Into Fixes
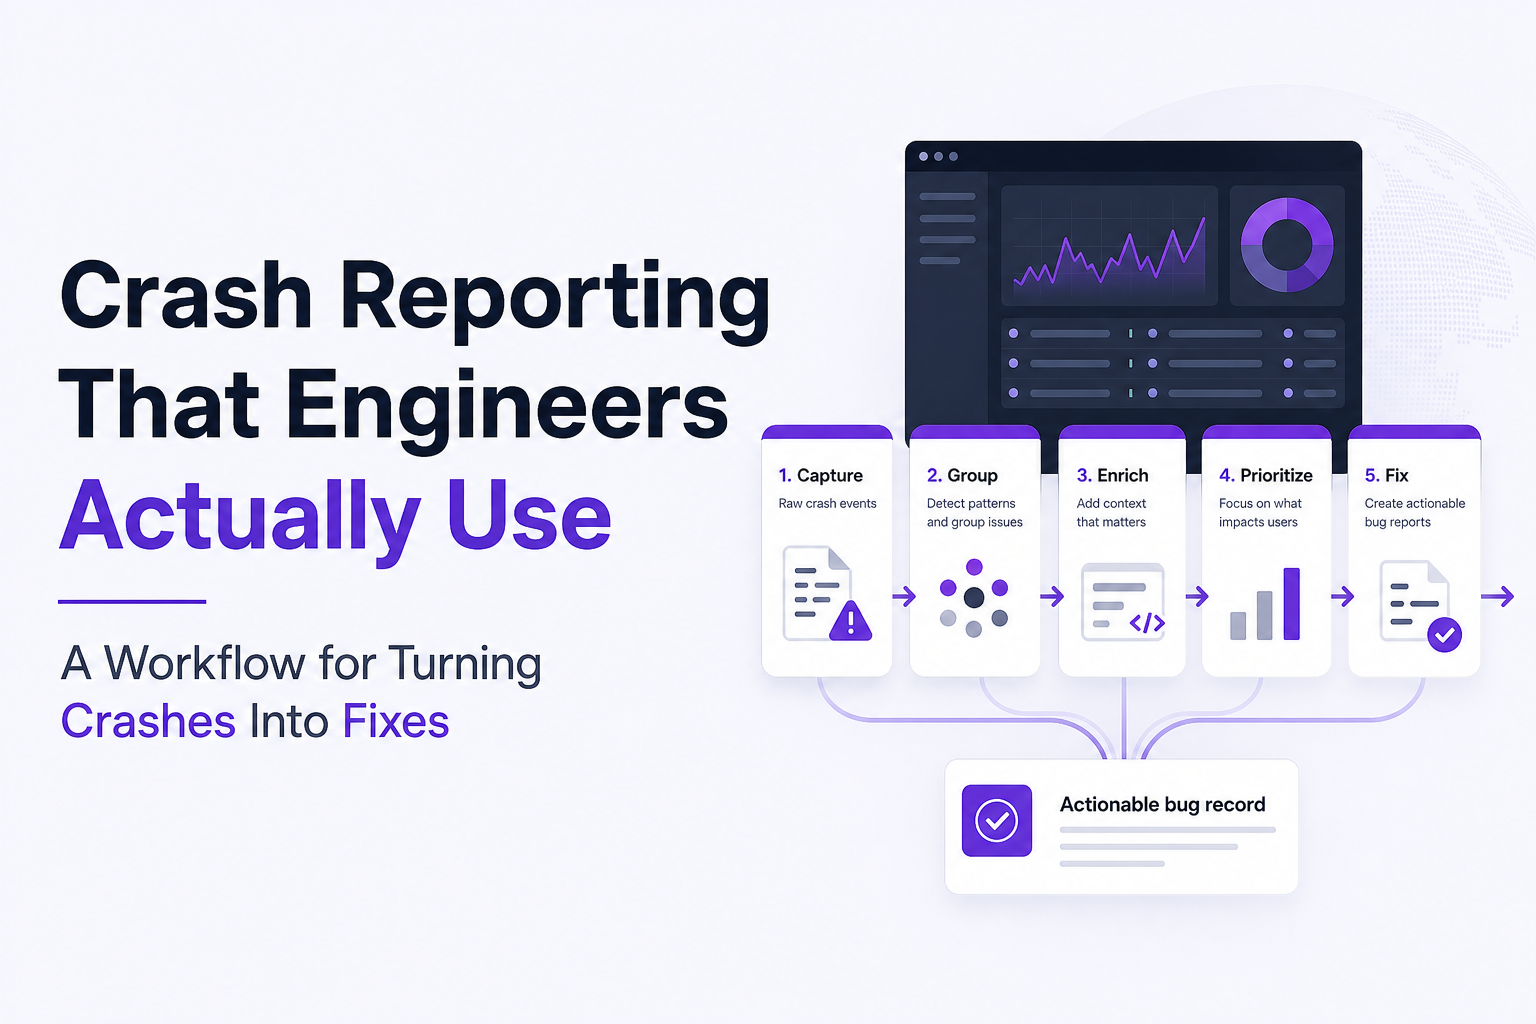
Crash reporting is supposed to shorten the path from “app broke” to “bug fixed.” In practice, many teams end up with the opposite: a firehose of exceptions, hundreds of duplicate alerts, and just enough missing context that engineers still cannot reproduce the failure. The result is predictable: crashes linger in production, support becomes the routing layer, and engineering spends time merging reports instead of fixing the root cause. This guide breaks down a concrete workflow for turning crash reporting into an actionable bug management system, including what to capture, how to group events into real bugs, and how to prioritize fixes based on impact.
- Define a “crash bug record” standard: minimum context, privacy rules, and ownership fields so every crash is actionable.
- Group raw crash events into one bug using deterministic fingerprints plus guardrails for releases, endpoints, and user flows.
- Prioritize fixes with a simple score built from affected users, frequency, recency, and business-critical paths.
What is crash reporting
Crash reporting is the process of automatically capturing application failures (for example, unhandled exceptions, fatal errors, or crash loops), packaging diagnostic context (stack trace, environment, user journey signals), and sending that data to a system where teams can analyze patterns and create fixable issues.
Crash reporting is not the same as logging
- Logging is broad and often developer-driven. It captures events you choose to emit.
- Crash reporting is failure-driven. It captures when the app breaks, even if no one anticipated that path.
A useful mental model is: logs help you understand what happened; crash reporting helps you answer “what should we fix next, and can we reproduce it?”
The output you actually need
Raw crash events are rarely the right unit of work. Engineering needs a bug-level record that answers five questions in one screen:
- What broke? (error class, message, stack trace)
- Where did it break? (module, endpoint, screen, feature)
- Who is affected? (unique users, accounts, segments)
- When did it start? (first seen, last seen, release correlation)
- Can we reproduce? (steps, request payload shape, environment)
Why crash reporting fails in practice even when you have plenty of data
Most teams do not fail because they lack crash data. They fail because the data does not reliably become an engineering action. Below are the most common failure modes, each with a concrete “symptom check” you can run on your own workflow.
Failure mode 1: Noise that drowns out true defects
Symptoms you can measure in a week:
- Alert-to-ticket ratio is high: many crash notifications, few tickets created.
- High “ignored” rate: issues closed as “not reproducible,” “user error,” or “already fixed” without verification.
- Support becomes the filter: engineers wait for support to confirm impact before acting.
Root cause: crash reporting is capturing events, not deciding which events are worth engineering attention.
Failure mode 2: Duplicate issues that fragment ownership
Duplicates happen when the same underlying bug shows up as multiple “unique” crashes. Common causes:
- Stack traces differ slightly due to async boundaries or minified bundles.
- Multiple entry points trigger the same failing code path.
- Retries create multiple crash events per user session.
Quick audit: pick your top 20 crashes by volume and ask, “How many Jira tickets exist for these 20?” If the answer is over 20, you are paying a duplicate tax.
Failure mode 3: Missing context that blocks reproduction
Engineers cannot fix what they cannot reproduce. The most common missing fields are not exotic:
- User path (what the user did right before the crash)
- Release/build (which deploy introduced it)
- Network details (endpoint, status code, latency, request shape)
- Environment (browser, OS, device, locale)
If your crash reporting tool shows a stack trace but not the user journey or failing request, engineers will still spend time asking follow-up questions in chat.
Failure mode 4: Ownership ambiguity and slow routing
Even when the crash is real and reproducible, it stalls if nobody knows who owns it. Typical signs:
- Crashes sit in “untriaged” for days.
- Tickets bounce between teams (frontend, backend, platform).
- Fixes land, but the crash remains because the wrong issue was addressed.
Root cause: crash reporting is not connected to a routing rule that maps crash types to teams, services, or repositories.
A crash reporting workflow that produces actionable bugs, not just alerts
The goal is simple: every real production crash becomes one clean bug record with enough evidence to reproduce, and it lands where it will be fixed. The workflow below is designed to be implemented incrementally. You can start with Step 1 and still see improvement.
Step 1: Define the minimum “crash bug record” you will accept
Use this checklist as a hard gate. If a crash record does not meet it, it should not become a ticket automatically.
- Fingerprint: stable signature for grouping (more on this in Step 2)
- Release/build: version, commit SHA, or build number
- First seen / last seen: timestamps plus count window (for example, last 24h)
- Affected users: unique users and sessions (not just event count)
- Environment: device, OS, browser/app version
- Reproduction hints: last user actions, screen, route, or endpoint
- Privacy guard: sensitive fields redacted before storage or ticketing
- Suggested owner: team/service mapping based on where it happened
If you need a concrete reference for what engineers look for when scanning failures, this stack trace example guide is a helpful complement, but the key is combining trace data with user and release context.
Step 2: Group crash events into “one bug” using a two-layer fingerprint
Grouping is where most crash reporting workflows win or lose. Use a two-layer approach: a deterministic core fingerprint plus guardrails that prevent over-grouping.
Layer A: Core fingerprint (deterministic)
- Error type (exception class)
- Top stack frames (for example, first 3 to 5 non-library frames)
- Failing surface (screen name, route, or endpoint)
Layer B: Guardrails (split when these differ)
- Major release line (group within the same release train; split across major versions)
- Endpoint family (for API-related crashes, do not group different endpoints)
- User flow (checkout vs onboarding might share code but need separate fixes)
Practical example: “TypeError undefined is not an object” is not a bug by itself. “TypeError in PricingModal during checkout submit on web@2.3.1” is a bug you can route and fix.
Step 3: Enrich each grouped bug with the context engineers actually use
Once events are grouped, enrich the grouped record. This is where you convert crash reporting from “exception dumps” into a debugging starting point.
- User journey trail: last 10 to 30 actions, navigation history, and the step where things started failing.
- Network envelope: failing request method, endpoint, status code, timing, and a redacted payload shape.
- Impact summary: unique affected users, frequency per hour, and whether it blocks a key action.
- Correlation pointers: link to related logs or traces using consistent IDs (request ID, session ID). If you are building this, a lightweight log correlation approach is often enough to cut investigation time.
Privacy note: treat enrichment as a security surface. Mask payment fields, tokens, and PII before anything leaves the client or enters tickets. OWASP’s logging guidance is a solid baseline: OWASP Logging Cheat Sheet.
Step 4: Apply noise control rules before creating tickets
Ticket creation should be the output of a filter, not the default. Use three gates:
- Validity gate: ignore expected failures (for example, user cancels auth, offline mode) based on explicit allow/deny rules.
- Dedup gate: only one open ticket per bug fingerprint per release line, with updates posted as comments.
- Threshold gate: create a ticket only when impact crosses a bar (for example, 10+ affected users in 24h, or any crash on a revenue path).
If your team struggles to keep the backlog clean, pair these gates with a short weekly review. This is different from broad issue triage sessions because you are reviewing grouped, enriched bug records, not raw alerts.
Step 5: Route the bug record to the right owner with a ticket-ready payload
Routing rules can be simple and still effective. Start with:
- Frontend crash (UI action, runtime exception) routes to web/mobile team.
- API 5xx or schema mismatch routes to the service owning the endpoint.
- Realtime/socket close codes routes to the realtime service owner.
Then standardize the ticket fields so engineers do not reformat data:
- Title format: [Surface] [Error] [Key context]
- Severity: derived from impact score (next section)
- Reproduction: ordered steps plus environment
- Evidence: links to grouped events, sample request, and release correlation
What to prioritize first, a simple scoring model for crash fix impact
When crash reporting is working, you will still have more bugs than time. Prioritization should be consistent and explainable. The model below is designed to be computed from the fields in your crash bug record, without requiring a full analytics rebuild.
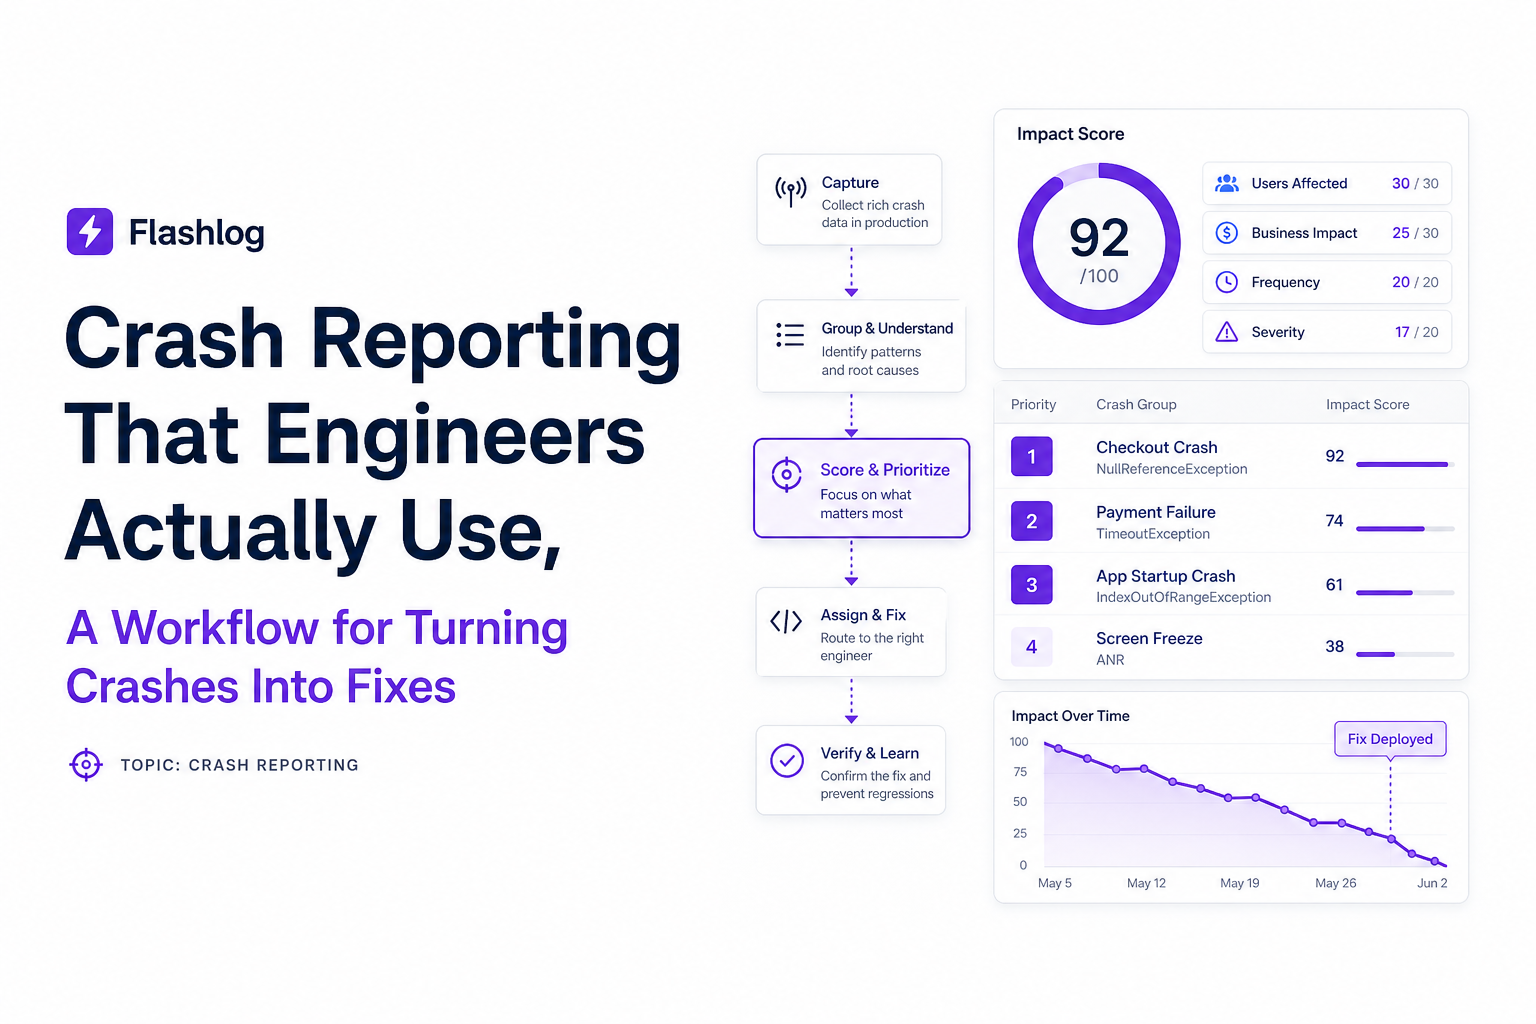
The 4-signal crash impact score
Score each bug from 0 to 100 using four signals. You can tune weights, but start with this baseline:
- Affected users (0 to 40 points): unique users in the last 24h or 7d.
- Frequency (0 to 25 points): events per hour (or per 1,000 sessions).
- Recency (0 to 15 points): started after the latest release or spiked recently.
- Business criticality (0 to 20 points): occurs on revenue or activation paths.
Concrete scoring rubric you can copy
- Affected users: 1 user = 5, 2 to 5 = 15, 6 to 20 = 25, 21 to 100 = 35, 100+ = 40
- Frequency: <1/hr = 5, 1 to 5/hr = 10, 6 to 20/hr = 18, 20+/hr = 25
- Recency: older than 30d = 0, 7 to 30d = 5, 1 to 7d = 10, since last deploy = 15
- Business criticality: non-core = 0, secondary flow = 10, core action blocked (checkout, signup, publish) = 20
How to use the score in practice
- 80 to 100: page someone, fix immediately, and consider rollback if tied to a release.
- 50 to 79: fix in the next sprint, track daily trend.
- 20 to 49: batch with similar issues, fix when touching related code.
- 0 to 19: monitor, likely edge cases or low impact.
This model also prevents “loud but low impact” crashes from dominating attention. A crash that happens 1,000 times to the same single user in a loop is noisy, but not necessarily high impact if it is isolated.
| Signal | What to measure | Common pitfall | Fix |
|---|---|---|---|
| Affected users | Unique users in a time window | Using raw event count | Deduplicate by user and session IDs |
| Frequency | Events per hour or per 1,000 sessions | Not normalizing for traffic spikes | Track rate, not just totals |
| Recency | First seen vs deploy time | Ignoring release correlation | Split groups by major release line |
| Business criticality | Flow classification (checkout, signup, publish) | Everything marked “high” | Define 3 tiers and enforce them |
FAQ
If your current crash reporting setup still leaves engineers sorting noise, consider adopting a workflow that captures production failures with the full trail, groups duplicates into one real bug, and routes a ticket-ready record into your tracker. Flash Log is built around that idea: it captures failures even when users never report them, preserves the path into the bug, and turns raw signals into a clean issue engineers can act on without backlog spam.
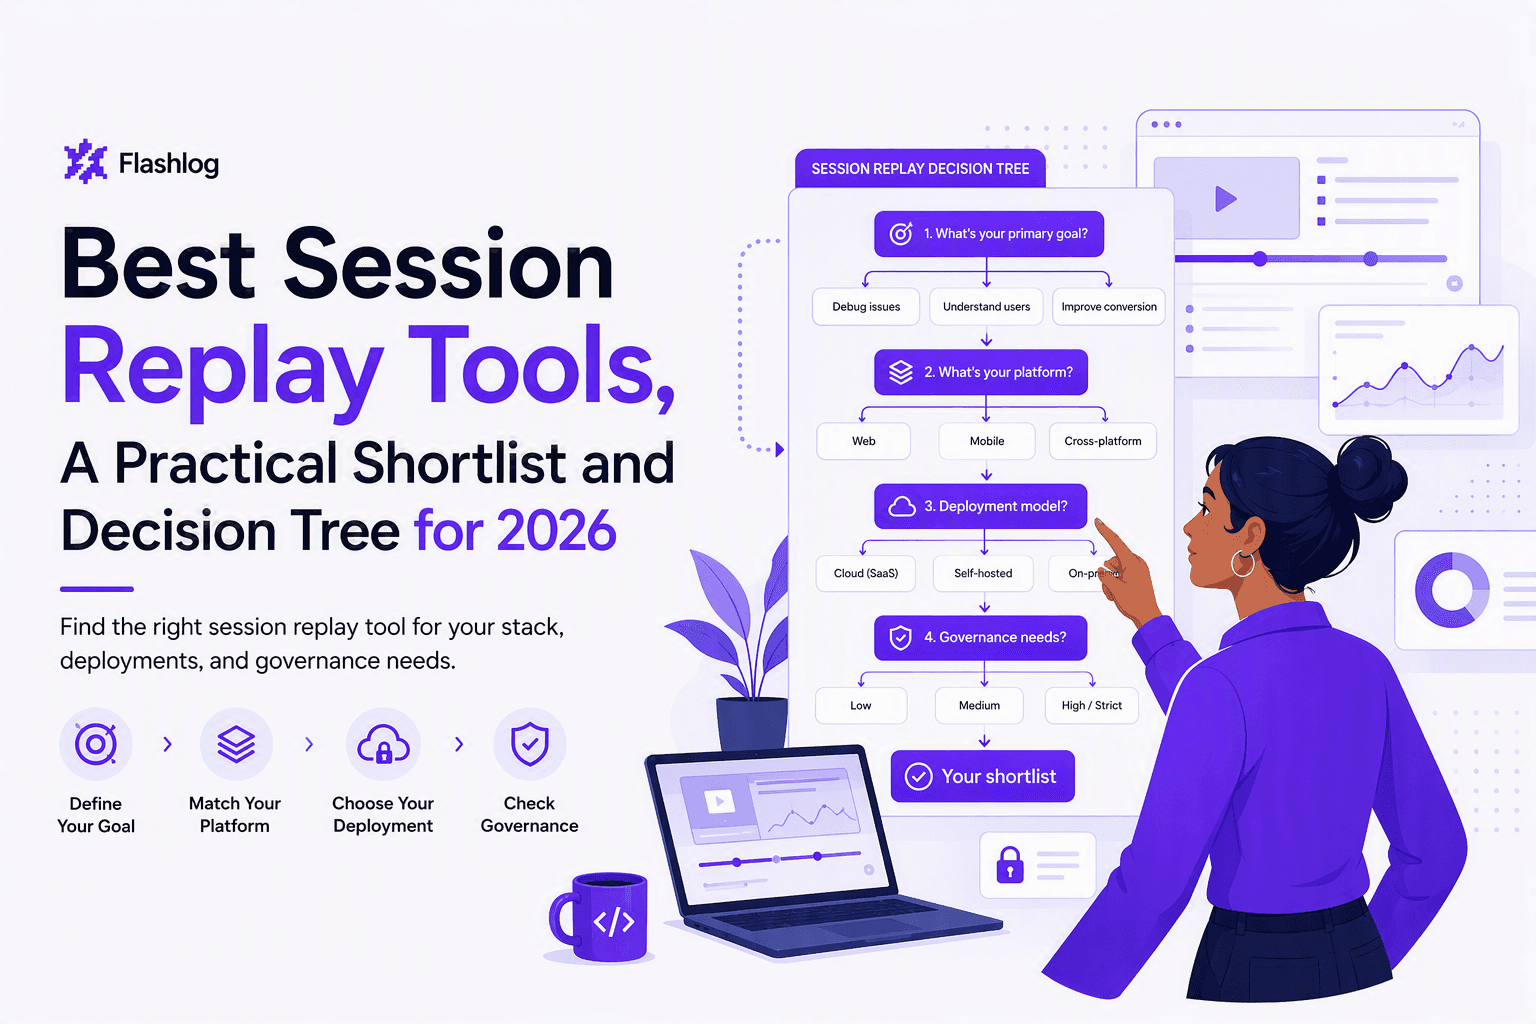
Best Session Replay Tools, A Practical Shortlist and Decision Tree for 2026
A buyer-focused shortlist of best session replay tools for 2026, with a decision tree, selection checklist, cost pitfalls, and a comparison table.
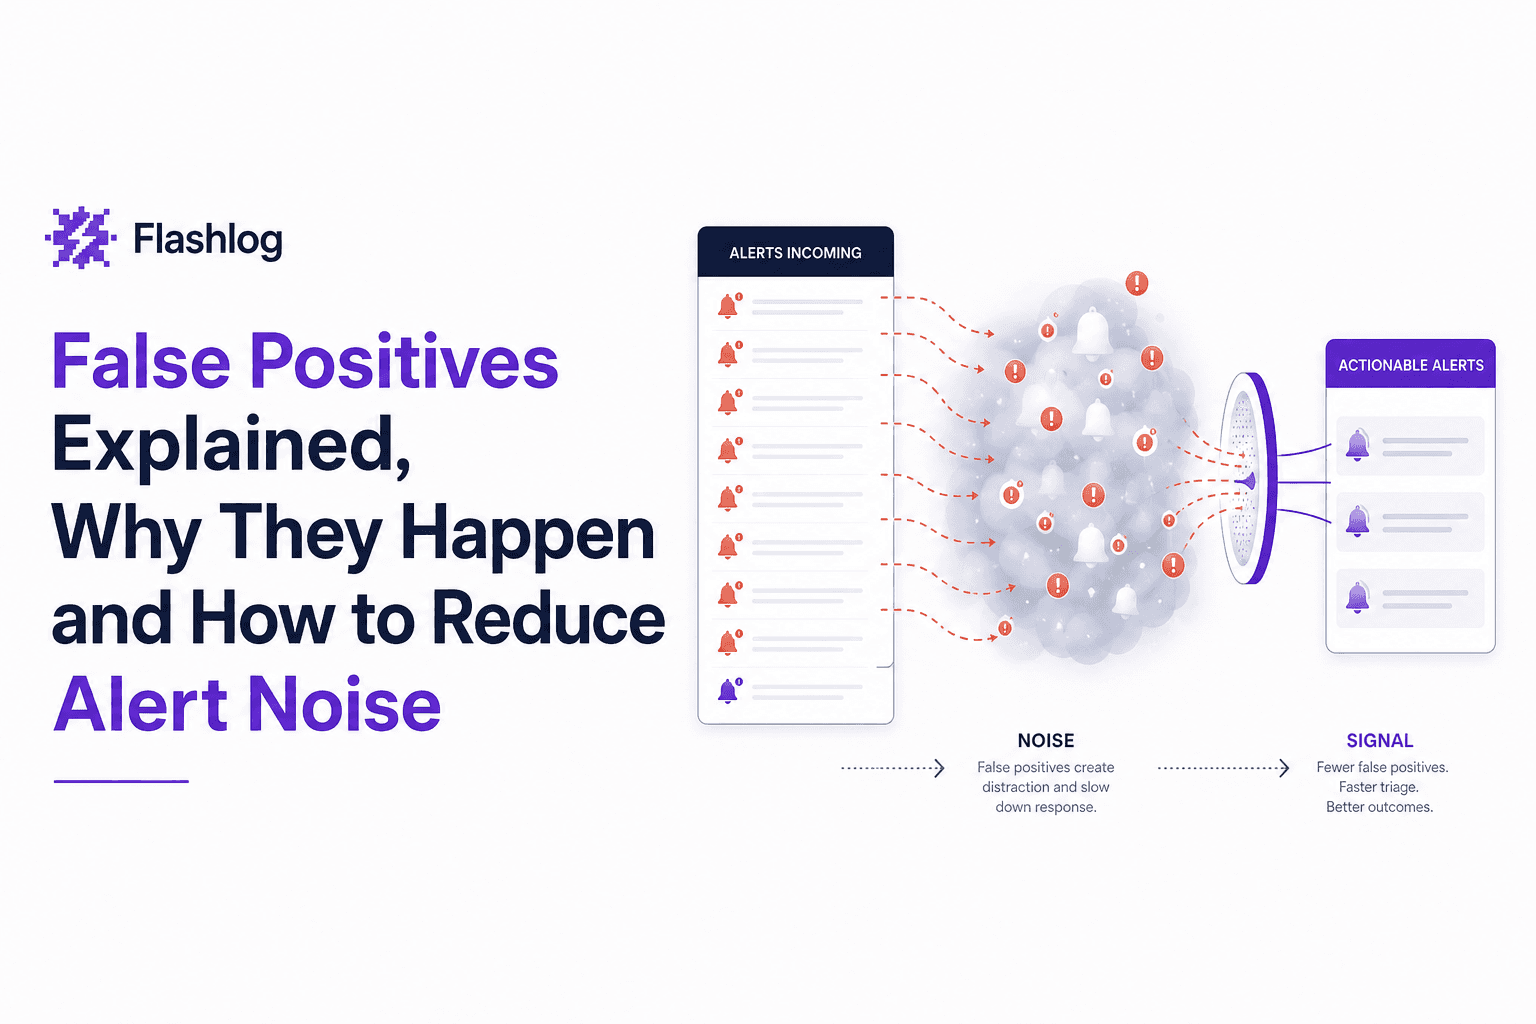
False Positives Explained, Why They Happen and How to Reduce Alert Noise
Learn what false positives are, why they create alert noise, and how to reduce false positives without missing real issues.
How to Choose Session Replay Tools for Faster Bug Triage and Safer Investigations
A practical framework to choose session replay tools: capture quality, integrations, privacy controls, hosting tradeoffs, and a pilot plan to cut triage time.