
Stack Trace Example Walkthroughs That Help You Find the Real Bug Faster
A production incident hits, users are blocked, and the only concrete clue you have is a stack trace example pasted into Slack. The hard part is not seeing the error message. It is deciding which line is actually yours, which frames are just plumbing, and what context is missing to reproduce the failure. In production, stack traces are often noisy, truncated, or wrapped by frameworks, so teams lose time chasing the wrong frame. This guide shows a repeatable way to read a trace, annotate it, and move from “it crashed” to a fixable hypothesis quickly.
- Use a simple “first actionable frame” rule to identify the line your team can change, not the framework code that only reports the failure.
- Classify the failure type (null reference, timeout, dependency error) and gather 3 missing signals (inputs, environment, and request path) before guessing.
- Follow a 5-step workflow to turn any stack trace example into a testable root-cause hypothesis and a minimal reproduction.
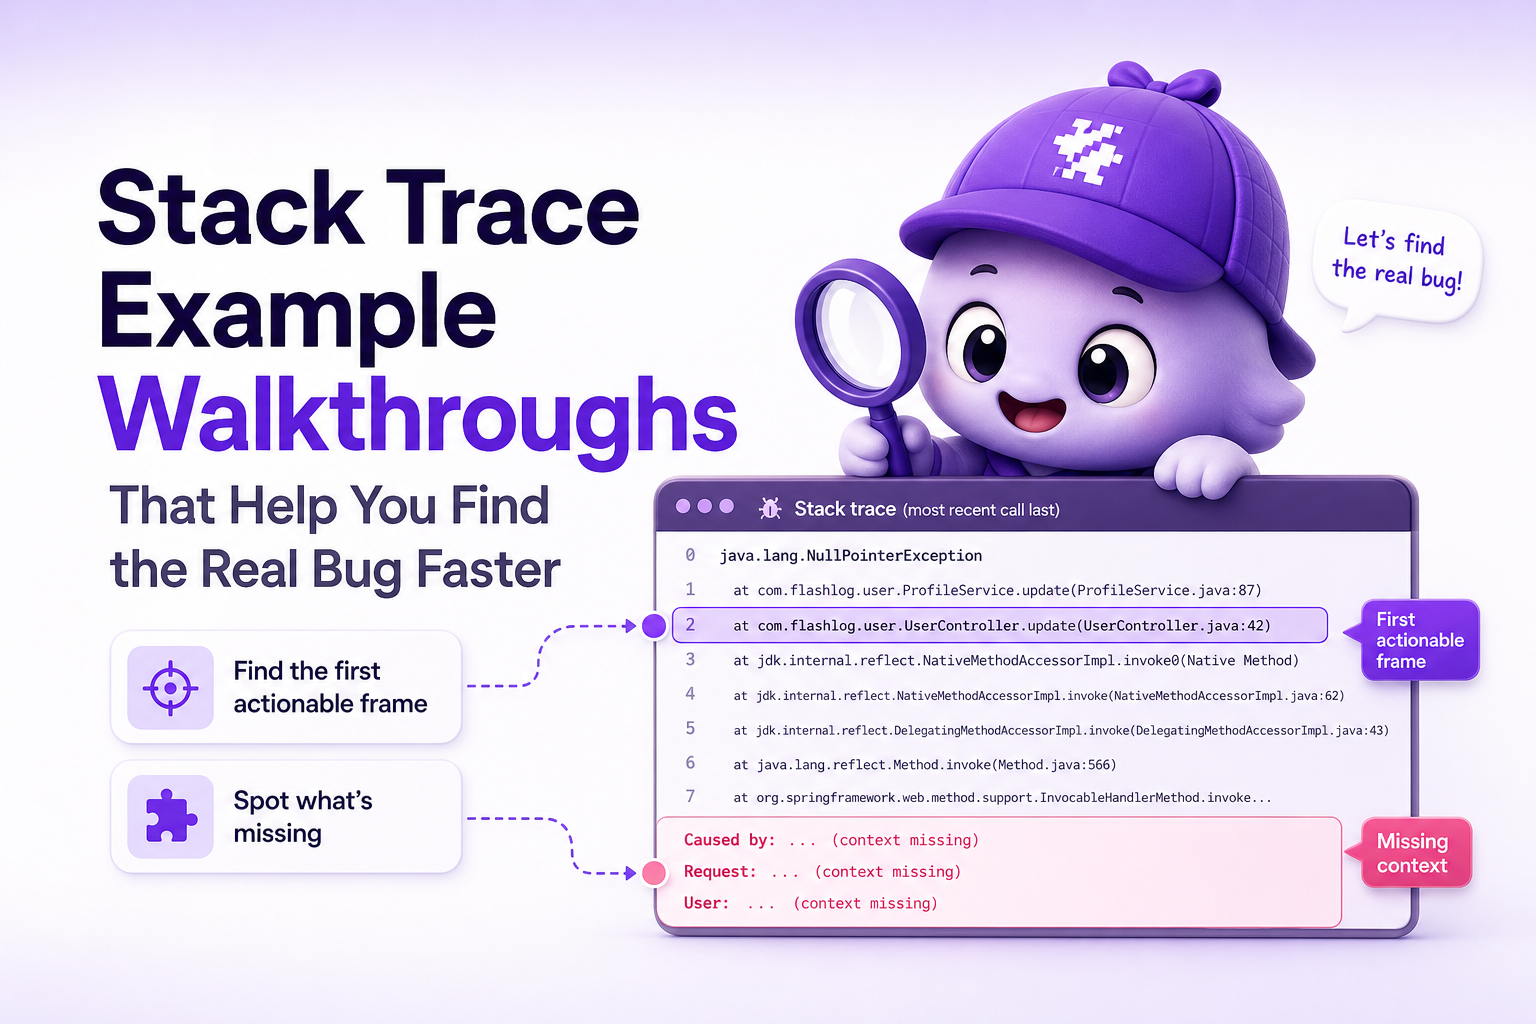
What is a stack trace example?
A stack trace is a snapshot of the call stack at the moment an error occurs. A stack trace example is simply a real instance of that snapshot, usually printed to logs or error monitoring, showing:
- The exception type and message (what failed).
- Frames (which functions were called, in order).
- File names and line numbers when symbols are available (where it failed).
What it is actually telling you
- Call order: which code paths led to the failure (most recent call is typically at the top in many runtimes, but not all formats).
- Boundary crossings: where your code hands off to a library, framework, or network client.
- A candidate failing line: often the line where the exception was thrown, not necessarily where the bug was introduced.
What it is not telling you (and why production traces mislead)
- It does not include inputs by default: the user ID, request body, feature flag state, and configuration that triggered the path are usually missing.
- It does not guarantee causality: the top frame is where the error surfaced, but the root cause can be earlier (bad data, race condition, stale cache).
- It can be incomplete: minified frontend bundles, missing source maps, truncated logs, or async boundaries can hide the important frame.
How it works in production and how to read it fast
To debug faster, treat every stack trace as a structured artifact you can parse with the same checklist. The goal is to find the first actionable frame, then collect the minimum missing context to confirm or reject a hypothesis.
The “first actionable frame” rule
Scan from the top (where the exception is reported) and stop at the first frame that meets all of these criteria:
- Owned by you: a file path or package namespace in your repo (not framework internals).
- Deterministic: a specific line number or function you can inspect and test.
- Closest to the throw: ideally where the exception is thrown, or where a failing dependency call is made.
Everything above that is usually “symptom routing” (middleware, controllers, handlers). Everything below helps you understand how you got there.
Annotate the trace with three labels
When you paste a stack trace example into an issue, add these annotations:
- [THROWN HERE] the line that threw (or surfaced) the exception.
- [ACTIONABLE] the first frame your team owns and can change.
- [CONTEXT NEEDED] the missing inputs needed to reproduce (request params, user action, payload fields, timing).
Know the three production patterns that distort stack traces
- Async boundaries: promises, futures, and task schedulers can break the logical chain. The trace shows where it was awaited, not where it originated.
- Wrapper exceptions: frameworks wrap the real error (for example, “Request failed” around a lower-level “ECONNRESET”). Look for a “Caused by” section or nested error.
- Minification and missing symbols: frontend traces may point to bundle offsets. Without source maps, you need the release version plus the exact user path.
Key benefits of using a repeatable stack trace example workflow
A consistent method matters because production debugging is a coordination problem, not just a code-reading problem. Here are practical benefits you can measure.
1) Faster time to the first testable hypothesis
Instead of debating which frame matters, the “first actionable frame” rule gets you to a hypothesis in minutes. Teams often stall because three people pick three different frames to investigate.
2) Fewer false fixes caused by blaming the top frame
The top of a stack trace example is frequently a controller or middleware that only reports the failure. Fixing there can mask the symptom and leave the real bug intact.
3) Better reproduction steps with minimal extra signals
When you always ask for the same missing context (inputs, environment, request path), you build reproducible bug reports. That reduces back-and-forth between support, on-call, and engineering.
4) Cleaner incident communication
Annotated traces make it obvious what the next action is. A good incident note includes: exception type, actionable frame, suspected trigger, and what data you still need.
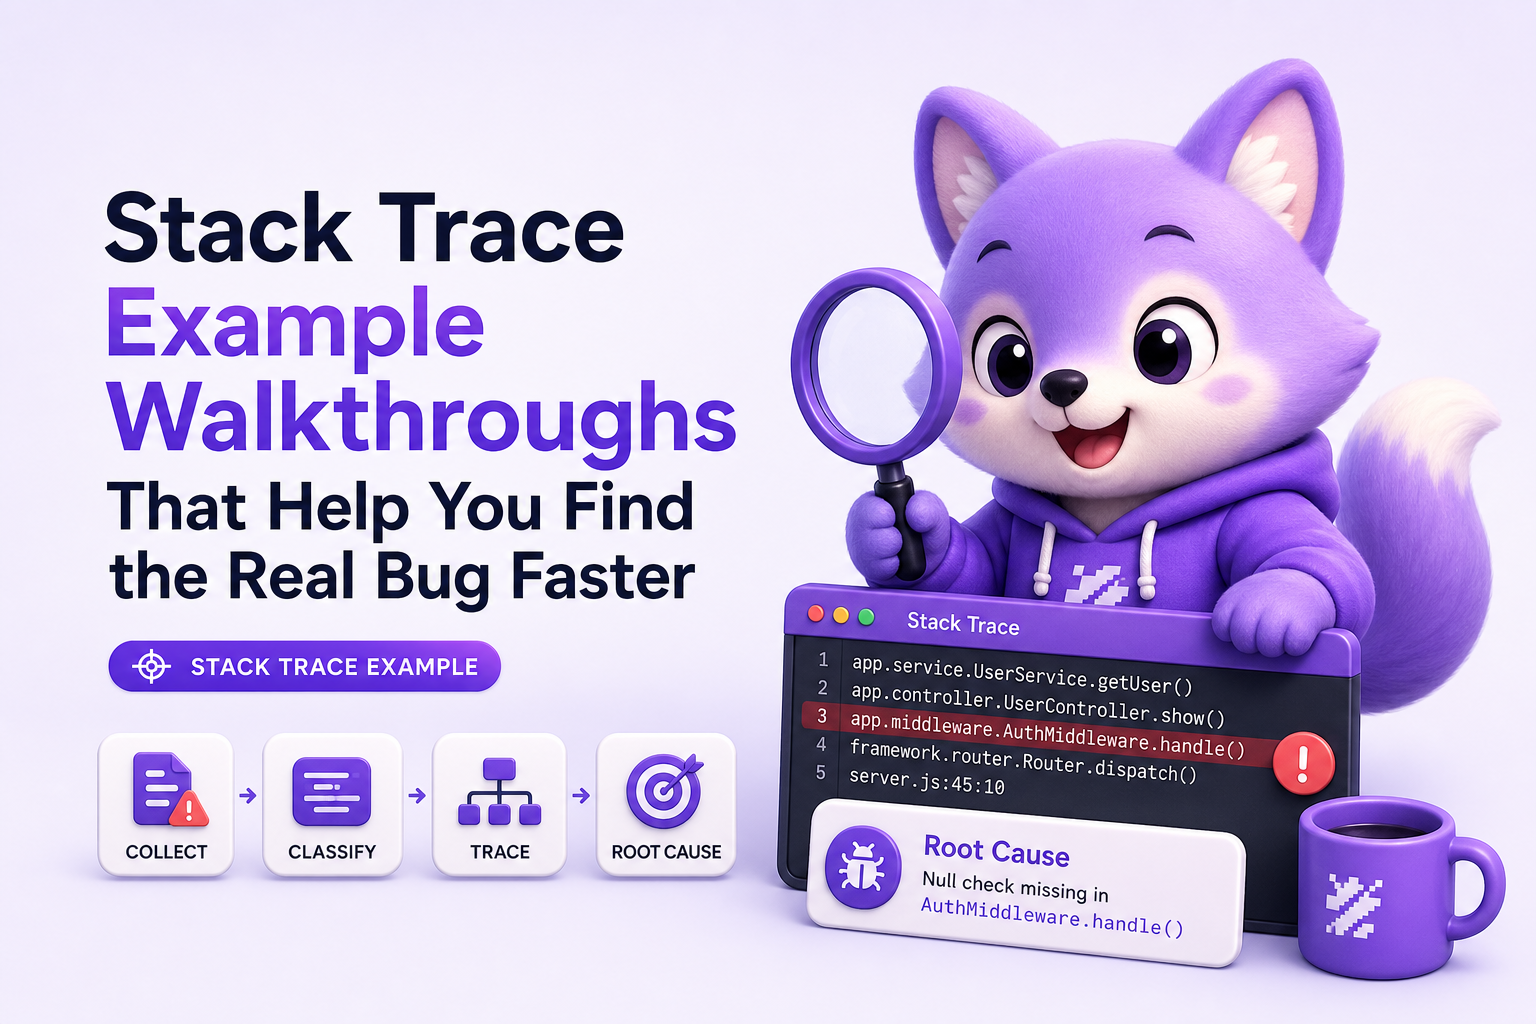
Common mistakes teams make with stack trace examples
Mistake 1: Treating the exception message as the root cause
Example: “Cannot read property ‘id’ of undefined” tells you what happened, not why undefined reached that line. The fix is often upstream validation or a missing guard on an API response.
Mistake 2: Stopping at the first frame you recognize
People often stop at a familiar framework file (router, servlet, express middleware). Instead, keep scanning until you hit code you own. That is usually the first actionable frame.
Mistake 3: Ignoring “Caused by” or nested errors
Dependency and timeout failures are commonly wrapped. If you only read the outer exception, you will miss the real failing subsystem (DNS, TLS, database pool exhaustion).
Mistake 4: Debugging without correlating the trace to a request or user path
A stack trace example without a request ID, endpoint, or user action history is a half-bug. At minimum, capture:
- Endpoint or UI action name
- Timestamp window and release version
- Inputs involved (sanitized)
If you want a deeper framework for tying these signals together, see log correlation.
Mistake 5: Not accounting for production-only differences
Common production-only causes include missing environment variables, different feature flags, stricter network policies, or a dependency version mismatch. Your workflow should explicitly check these before you assume “it works on my machine.”
Stack trace example walkthroughs from real production patterns
Below are three annotated walkthroughs. Each one shows how to locate the first actionable frame and what extra context you need to confirm the root cause. Use these as templates when you write incident notes.
Walkthrough 1: Null reference or undefined access
Scenario: A checkout page crashes for some users after a deploy.
TypeError: Cannot read properties of undefined (reading 'id')
    at buildOrderPayload (src/checkout/payload.ts:88:21)
    at submitOrder (src/checkout/submit.ts:41:13)
    at onConfirmClick (src/checkout/ui.tsx:203:9)
    at HTMLButtonElement.<anonymous> (src/vendor/react-dom.production.min.js:12:3456)
How to read this stack trace example:
- [THROWN HERE]
buildOrderPayloadline 88 is whereundefined.idis accessed. - [ACTIONABLE]
src/checkout/payload.ts:88is your code and is the first actionable frame. - [CONTEXT NEEDED] Which field was undefined? Was it
customer,shippingAddress, or an API response object?
Minimal checklist to confirm cause:
- Inspect line 88 and identify the variable being dereferenced.
- Add a temporary guard or structured log to record whether the variable is missing (without leaking sensitive fields).
- Check if the value comes from an API response. If yes, compare responses for affected vs. unaffected users.
- Verify whether a feature flag or experiment changes the payload shape.
Typical root causes: API returned a partial object, frontend assumed a field is always present, or a new release changed the schema without backward compatibility.
Walkthrough 2: Timeout that looks like “random slowness”
Scenario: A background job starts failing intermittently.
TimeoutError: Request timed out after 5000ms
    at HttpClient.request (lib/http/client.js:211:17)
    at fetchPricing (src/services/pricing.ts:57:22)
    at quoteOrder (src/orders/quote.ts:104:15)
    at processOrderJob (src/jobs/processOrder.ts:33:9)
    at run (lib/queue/worker.js:88:11)
Caused by: ETIMEDOUT 10.0.12.8:443
How to read this stack trace example:
- [THROWN HERE] The HTTP client timed out, but the nested “Caused by” shows a network-level timeout to
10.0.12.8:443. - [ACTIONABLE]
src/services/pricing.ts:57is the first place you control: timeout config, retries, fallback behavior, and which endpoint is called. - [CONTEXT NEEDED] Which region, which dependency instance, and what latency distribution preceded the failures.
Minimal checklist to confirm cause:
- Identify the dependency: which hostname maps to
10.0.12.8in that environment. - Check whether failures correlate with a specific deploy, region, or time window.
- Compare p95 and p99 latency before and after the incident window.
- Validate whether 5 seconds is an appropriate timeout for that call, and whether retries are safe.
For a practical way to triage endpoint failures and distinguish client timeouts from server-side 5xx, see api errors.
Walkthrough 3: Dependency error wrapped by a framework
Scenario: Login intermittently fails, but the app only logs a generic 500.
InternalServerError: Request failed
    at handleRequest (src/server/http.ts:119:11)
    at router (lib/framework/router.js:402:9)
    at middleware (lib/framework/middleware.js:88:7)
Caused by: SequelizeConnectionError: too many connections
    at ConnectionManager.getConnection (node_modules/sequelize/lib/dialects/abstract/connection-manager.js:261:13)
    at authenticate (src/db/index.ts:44:5)
How to read this stack trace example:
- [THROWN HERE] The outer error is generic. The nested error is specific:
too many connections. - [ACTIONABLE]
src/db/index.ts:44is your code and indicates where you open or manage DB connections. - [CONTEXT NEEDED] Current connection pool settings, concurrent request rate, and whether connections are leaked on a specific path.
Minimal checklist to confirm cause:
- Check DB metrics: active connections vs. max allowed, and connection churn.
- Inspect recent changes that might create new connections per request.
- Verify pool configuration (max, idle timeout) and whether the app runs multiple replicas.
- Look for a correlated endpoint or job that spikes connections.
External reference: connection pool exhaustion is a common failure mode in production systems. For background on pooling behavior and limits, see PostgreSQL connection settings.
A 5-step method to go from stack trace to root cause faster
This is the repeatable workflow you can apply to any stack trace example, regardless of language or framework. It is designed to minimize guessing and maximize confirmation.
Step 1: Normalize the trace into a consistent format
- Copy the full trace including any “Caused by” sections.
- Add the release version, environment, and timestamp.
- If frontend, include the bundle version or commit SHA and whether source maps exist.
Step 2: Identify the first actionable frame
Apply the rule from earlier and write it down explicitly:
- Actionable file:
path/to/file - Actionable line:
123 - Function:
doThing()
If you cannot find an actionable frame, your next task is not “debug.” It is “improve symbolization or capture more context.” For related guidance, see stack traces in production.
Step 3: Classify the failure type and pick the right next question
| Failure type | What the trace usually shows | Your next question | Minimum extra context to collect |
|---|---|---|---|
| Null reference / undefined | TypeError or NullPointerException at a specific line | Which input was missing and why? | Payload shape, user path, feature flags |
| Timeout | TimeoutError and a client call frame | Is it dependency latency, DNS, TLS, or saturation? | Endpoint, region, p95/p99 latency, retries |
| Dependency rejection | Wrapped exception with “Caused by” | Which dependency limit was hit? | Status codes, error codes, pool metrics, quotas |
| Data or schema mismatch | Parsing or validation errors | Which producer changed and when? | Schema versions, sample failing record (redacted) |
Step 4: Form a single hypothesis and one quickest test
Write one sentence:
- Hypothesis template: “If X happens, then Y becomes invalid, which causes the exception at actionable frame.”
- Quick test template: “Reproduce by steps with inputs in environment.”
This prevents parallel “maybe it is…” threads that never converge.
Step 5: Capture the missing context once so you do not re-investigate
When the stack trace example lacks context, decide what to capture next time. The minimal set that usually pays off:
- Request or session correlation: request ID, trace ID, or a stable event ID.
- User path into the bug: last 5 to 20 actions, route changes, or job steps.
- Environment and release: browser/OS/device for frontend, region and instance for backend.
- Sanitized inputs: the specific fields that influence the failing branch.
If your team is still aligning on terminology, this guide on stack trace meaning can help standardize how you discuss frames and causes.
FAQ
When you apply the same workflow to every stack trace example, debugging becomes less about intuition and more about fast confirmation: find the first actionable frame, classify the failure, gather the missing context, and run one quick test. If you want production failures to arrive with the request, user path, environment, and a ticket-ready summary already attached, Flash Log is built to capture that context automatically so engineers can move from stack trace to fix with fewer back-and-forth cycles.

Bug Tracking Software for Support Teams - A Proactive Intake and Triage Framework
Bug tracking software for support teams: a proactive intake and triage workflow, severity standards, and tool scorecard to prevent backlogs.

Software Bug Tracking System Buyer Guide, How To Choose The Right One In 2026
A practical 2026 buyer guide to pick a software bug tracking system using criteria, a shortlist by use case, and a rollout checklist.
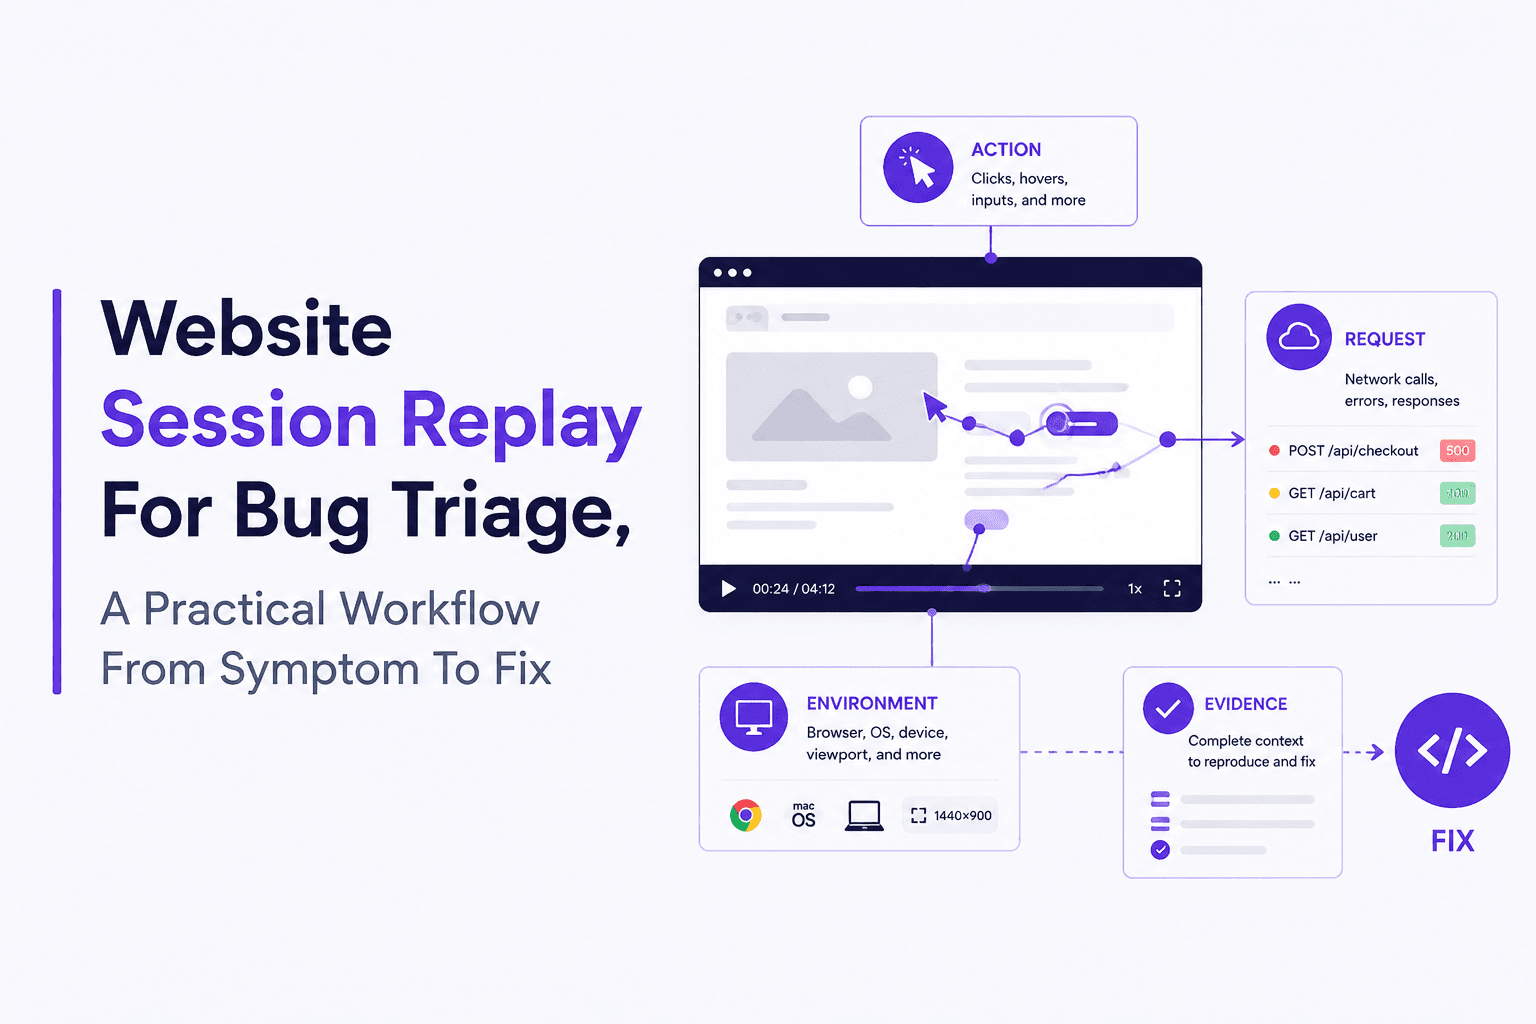
Website Session Replay For Bug Triage, A Practical Workflow From Symptom To Fix
Use website session replay for bug triage: what to capture, a checkout drop-off example, privacy-safe setup, and how to choose replay tools.