
Stack Trace Explained, How To Read It And What To Collect When It’s Not Enough
A stack trace is often the first thing engineers reach for when a production error fires, but a stack trace alone rarely tells you what the user did, what input triggered it, or which release introduced it.
- A stack trace tells you where code failed, not necessarily why it failed. Treat it as a pointer, then collect the missing context.
- Read stack traces with a repeatable method: find the first relevant frame, confirm the boundary, and validate with request, user, and release data.
- Use a context checklist (inputs, user actions, environment, versions, timing) to turn a stack trace into a reproducible bug report.
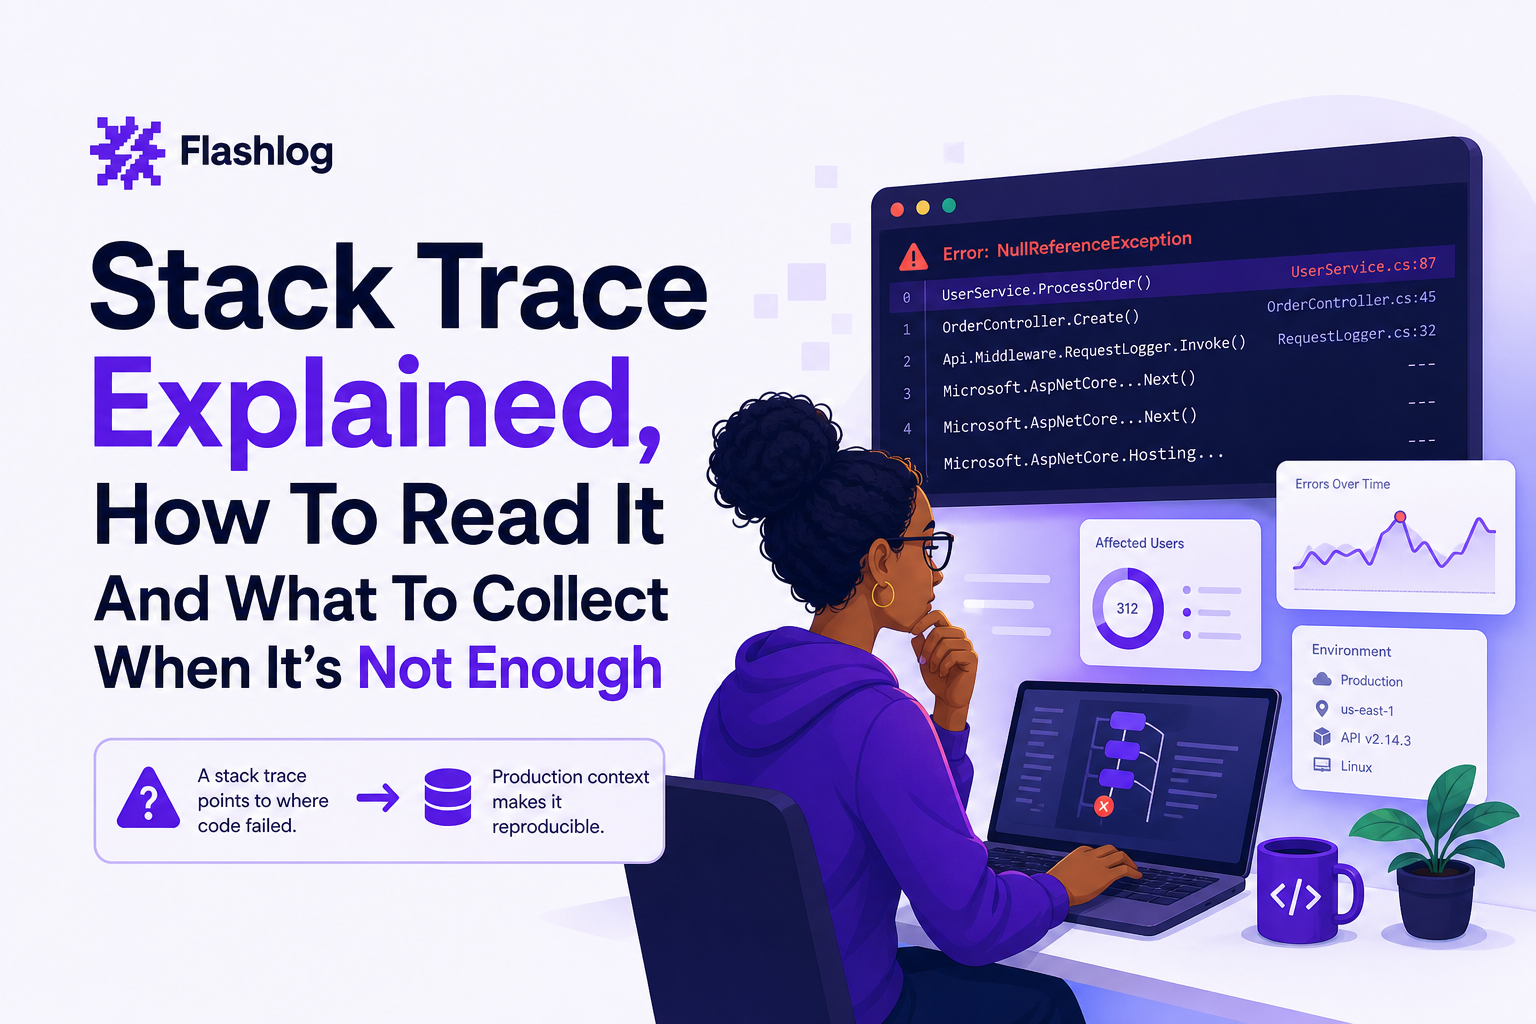
What a Stack Trace Is and What It Can (and Can’t) Tell You
A stack trace is a snapshot of the call stack at the moment an error occurred. It’s usually printed when an exception is thrown (or an error is logged) and it lists frames: each frame represents a function call, method invocation, or execution boundary that led to the failure.
Quick definitions you’ll see in real traces
- Call stack: the ordered list of active function calls at a moment in time.
- Frame: one entry in the stack, typically showing function name, file, and line/column.
- Top vs bottom: most runtimes show the most recent call first (top), with older calls below.
- Exception type/message: the error class and message, for example
TypeError: Cannot read properties of undefined.
What a stack trace is great for
In practice, a stack trace is best at answering “where did the program notice something went wrong?” It helps you:
- Jump to the failing code path quickly (file and line number when symbols and source maps exist).
- See the chain of calls that led to the failure (especially useful for unexpected re-entrancy or recursion).
- Spot common failure boundaries: serialization, validation, database calls, network clients, template rendering.
What a stack trace cannot tell you (the production gap)
In production, the “where” is often not enough. A stack trace typically does not include:
- The triggering input (payload, query params, headers, form fields).
- User journey (which page, which click, what sequence of actions).
- Environment and release metadata (browser/OS, device, feature flags, build SHA, deploy time).
- Timing and concurrency context (race conditions, retries, async ordering).
That’s why teams end up with a stack trace that points to a line like “parseCheckout()” but still cannot reproduce the bug locally.
How to Read a Stack Trace Without Getting Misled
The fastest way to waste time is to treat the first frame you see as the root cause. Use a consistent reading method so you don’t chase wrappers, framework internals, or minified bundles.
A 5-step reading method we use in production triage
- Start at the exception type and message. Categorize it: null reference, bounds error, permission, timeout, deserialization, etc.
- Find the first “your code” frame. Skip runtime/framework frames until you hit your repository modules.
- Mark the boundary frame. Identify where your code calls an external boundary: DB, HTTP client, queue, filesystem, crypto, third-party SDK.
- Ask what must be true for this line to fail. Write 2 to 4 preconditions (for example “userId is missing”, “price is NaN”, “response body is not JSON”).
- Validate with context signals. Confirm which precondition is plausible using request metadata, user actions, and release/version info.
Common stack trace traps and how to avoid them
- Wrapper functions: error boundaries, middleware, decorators. Solution: look for the first frame that includes business objects or domain names, not “handleRequest()”.
- Async gaps: promises, callbacks, task schedulers can break causal ordering. Solution: look for “async stack traces” support in your runtime and correlate with timestamps.
- Minified or bundled code (frontends): line numbers point into a bundle. Solution: ensure source maps are uploaded and accessible in your error tooling; otherwise you’re debugging compiled output.
- Re-thrown exceptions: the stack trace shows where it was re-thrown, not where it originated. Solution: search logs for the earliest occurrence of the same error signature and request ID.
A tiny example of “first relevant frame” thinking
If a stack trace shows:
at renderToString (react-dom...)at ErrorBoundary (app...)at formatCurrency (pricing.ts:84)
Start at formatCurrency. The framework frames tell you the symptom surfaced during rendering, but your actionable hypothesis is likely “currency code missing” or “amount is undefined”. If you need a more complete walkthrough, see this stack trace example guide.
Why Stack Traces Fail in Production, the Missing Context Checklist
A stack trace is a map pin, not the whole route. The reason production debugging drags is that the route is missing: what happened right before the failure, under which conditions, and with what inputs.
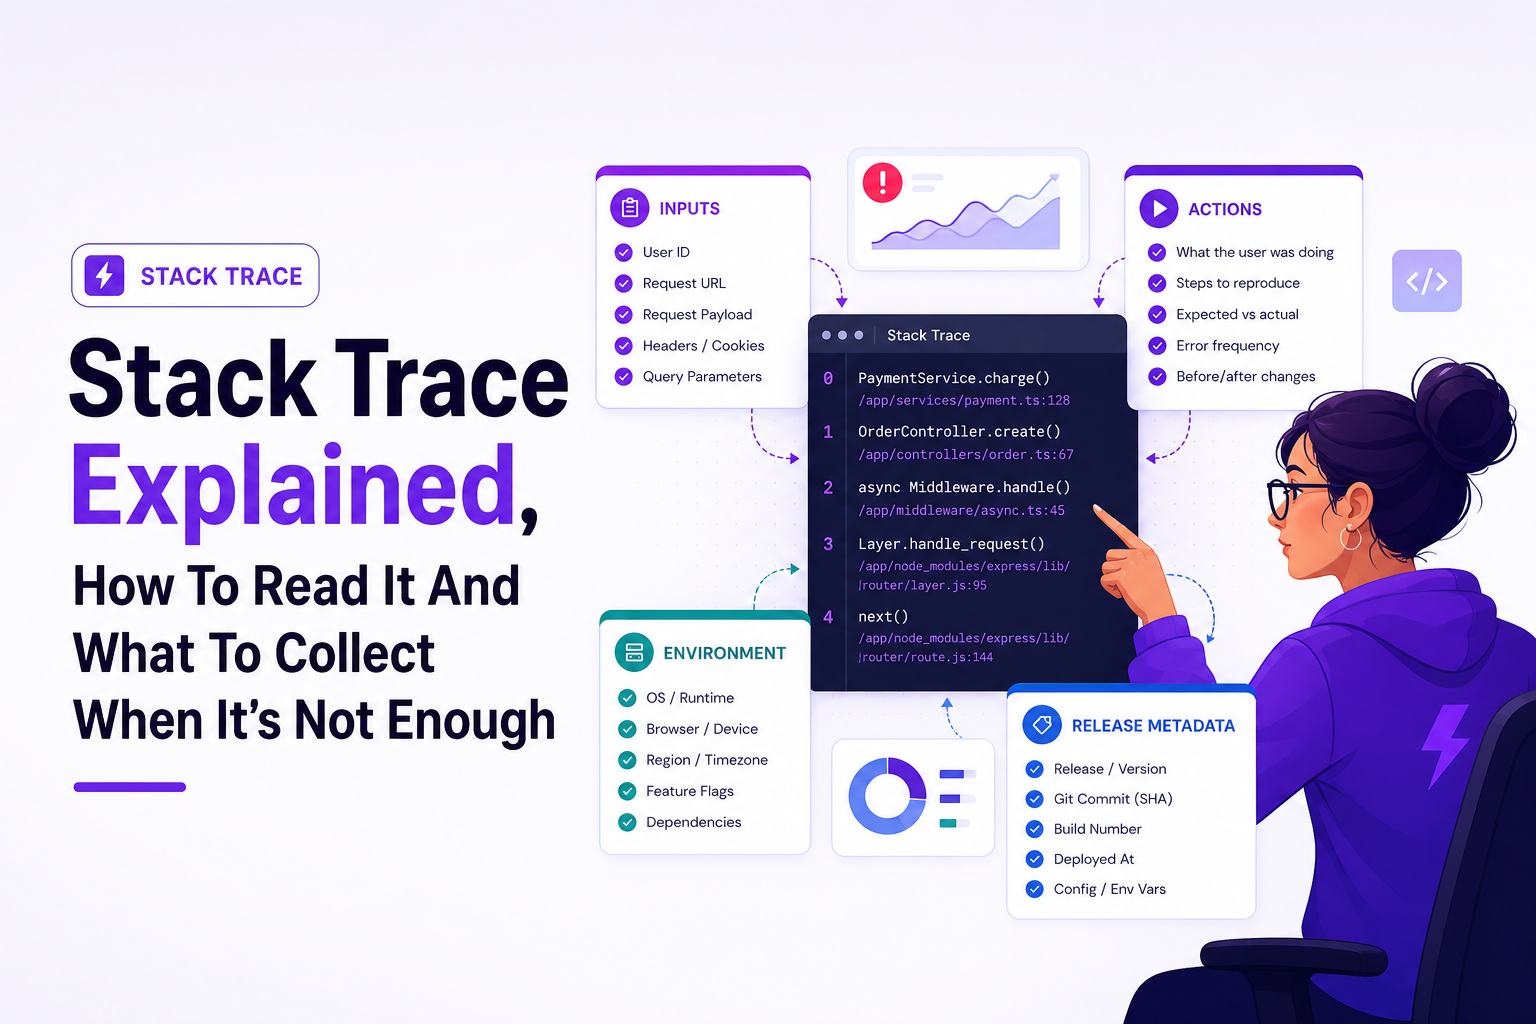
The production unknowns mapped to a checklist
When a stack trace is not enough, run this checklist and attach the answers to the issue. If you can’t answer an item, that’s the next thing to instrument.
| Missing context | Why it matters | What to capture (concrete fields) |
|---|---|---|
| Inputs | Most bugs are input-shape or edge-case driven | Request method, URL, status, sanitized payload shape, key headers, validation errors |
| User actions | Reproduction depends on sequence, not just endpoint | Last 5 to 20 UI events, page path, clicked element label, form submit, navigation history |
| Environment | Many issues are device, browser, or network specific | Browser/OS/device, viewport, locale/timezone, network type, memory pressure signals |
| Versions and release metadata | Pinpoints regressions and feature-flag interactions | App version/build SHA, deploy timestamp, feature flags, config versions |
| Timing and correlation | Async retries and races can invert cause and effect | Timestamps, duration/latency, correlation ID, trace/span IDs, retry count |
How to use the checklist with a stack trace
Take the top “your code” frame from the stack trace and translate it into a single sentence hypothesis, then use the checklist to prove or disprove it. For example: “Checkout submit fails because the API returned 500 for certain payloads on mobile Safari.” That sentence forces you to gather payload shape, failing request details, environment, and release version, not just the stack trace.
A Practical Workflow to Turn Stack Traces Into Reproducible Bugs
Here’s a workflow that turns “we have a stack trace” into “we can reproduce it in under 15 minutes.” The key is to treat each step as an information gain stage and stop only when reproduction is reliable.
Step 1: Normalize the alert into an “issue signature”
- Group by: exception type + top relevant frame + endpoint/page.
- Record: first seen, last seen, count, affected versions.
- Goal: avoid chasing one-off noise and focus on repeatable failures.
Step 2: Attach the minimum repro package
Before anyone opens an IDE, attach these fields to the issue:
- Failing request: method, URL, status, duration, sanitized payload metadata.
- Last actions: the last meaningful user events leading into the failure.
- Environment: browser/OS/device, viewport, network type.
- Release metadata: app version/build SHA, feature flags or config versions.
In our experience working with on-call rotations, the biggest time saver is forcing this package to exist before deep debugging, because it prevents the common loop of “can you ask the user what they clicked?” after the fact.
Step 3: Reproduce in the closest environment first
- If it’s browser-specific, reproduce on the same browser/OS and viewport.
- If it’s release-specific, check out the exact build SHA or deploy artifact.
- If it’s data-specific, replay with the same sanitized payload shape and IDs where safe.
Step 4: Confirm the hypothesis with targeted logging, not blanket logs
Add logs that validate the preconditions you wrote when reading the stack trace: “is currencyCode null?”, “did the feature flag evaluate true?”, “did we receive an empty array?” This keeps logs high-signal and reduces the need for broad “log everything” changes. If you want a fast structure for this stage, this issue triage framework pairs well with stack trace driven debugging.
Step 5: Fix, then backfill a regression test and a guardrail
- Regression test: unit/integration test using the captured payload shape and environment assumptions.
- Guardrail: validation with clear error messages, or a safe fallback path.
- Monitor: confirm the issue signature stops occurring in the next release.
Information Gain, How to Collect Error Context Automatically Without Waiting for User Reports
Waiting for a user to report “what they did” is slow and often inaccurate. The alternative is passive context capture: collect the evidence around the error at the moment it happens, then link it back to the stack trace.
The 3-link chain that makes stack traces actionable
- Stack trace to request: tie the exception to the failing HTTP call (method, URL, status, latency).
- Request to session: tie the call to a user session (anonymized user ID, session ID, navigation path).
- Session to release: tie the session to build SHA, feature flags, and environment.
After running several logging audits, the pattern was clear: teams had either great stack traces or great request logs, but without a shared correlation ID the two never met, and reproduction stayed guessy.
Correlation IDs and trace IDs, the minimum viable setup
- Generate a correlation ID at the edge (or client) and propagate it through headers (for example
X-Request-ID). - Log it everywhere: frontend error events, backend request logs, job/queue handlers, and downstream calls.
- Store timestamps with consistent precision and timezone (UTC) so ordering is reliable.
If you’re using distributed tracing, follow the W3C Trace Context spec for propagation: traceparent and tracestate. Even without full tracing, a single correlation ID dramatically improves log correlation and helps you connect the stack trace to the real failing request.
Privacy and security basics when capturing context
- Mask sensitive inputs before they leave the client or hit shared logs (passwords, tokens, card numbers).
- Prefer “shape” over “value”: record which fields were present and their types/lengths rather than raw values.
- Access control: limit who can view session-level context and retain it for the shortest useful window.
This is also where “debugging in production” discipline matters: capture enough context to reproduce, but not so much that you create a privacy incident. For a safety-first workflow, see debug in production.
Stack Trace FAQs for Modern Apps
If you want stack trace events to arrive already bundled with the user journey, failing request, environment, and masked inputs, Flash Log is built to capture and package that reproduction context automatically so engineers can move from stack trace to reproduction without waiting on user reports.

Debug In Production Without Panic, A Safety-First Workflow for Live Issues
Learn how to debug in production safely with a containment-first workflow, guardrails, and checklists to fix live issues fast.

Log File Analyzer Workflow That Cuts Noise, A Practical Step-By-Step Guide
A practical log file analyzer workflow to filter noise, find real errors fast, and know when online tools or AI triage make sense.
Session Replay Software Buyer’s Guide, Features, Privacy, And A Shortlist Comparison
A practical session replay software buyer’s guide with evaluation criteria, rollout checklist, privacy playbook, and a shortlist comparison table.