
Debug In Production Without Panic, A Safety-First Workflow for Live Issues
When you have to debug in production, you are trading comfort for truth: real users, real traffic, real edge cases. The risk is obvious, but so is the cost of waiting for a perfect staging repro while customers churn, revenue drops, and support tickets pile up. This guide gives you a safe, repeatable workflow to investigate live issues without “cowboy fixes”, using containment-first steps that reduce blast radius while speeding up learning.
- Use a containment-first loop: stabilize, reproduce, observe, verify, then ship the smallest safe change.
- Add guardrails before you investigate: feature flags, scoped rollouts, reversible changes, and privacy-safe logging.
- Measure progress with time-to-clarity and blast radius, not just time-to-deploy.
Direct answer: the safest way to debug in production
The fastest low-risk approach is a containment-first workflow:
- Stabilize the user impact (stop the bleeding) with rollback, kill switch, or reduced scope.
- Reproduce the failure on real conditions using a tight “repro contract” (who, where, when, what action, expected vs actual).
- Observe with targeted instrumentation (scoped logs, traces, metrics) that answers one hypothesis at a time.
- Verify the fix using canary and success metrics, then remove the extra instrumentation.
This is how you debug in production without turning one incident into three.
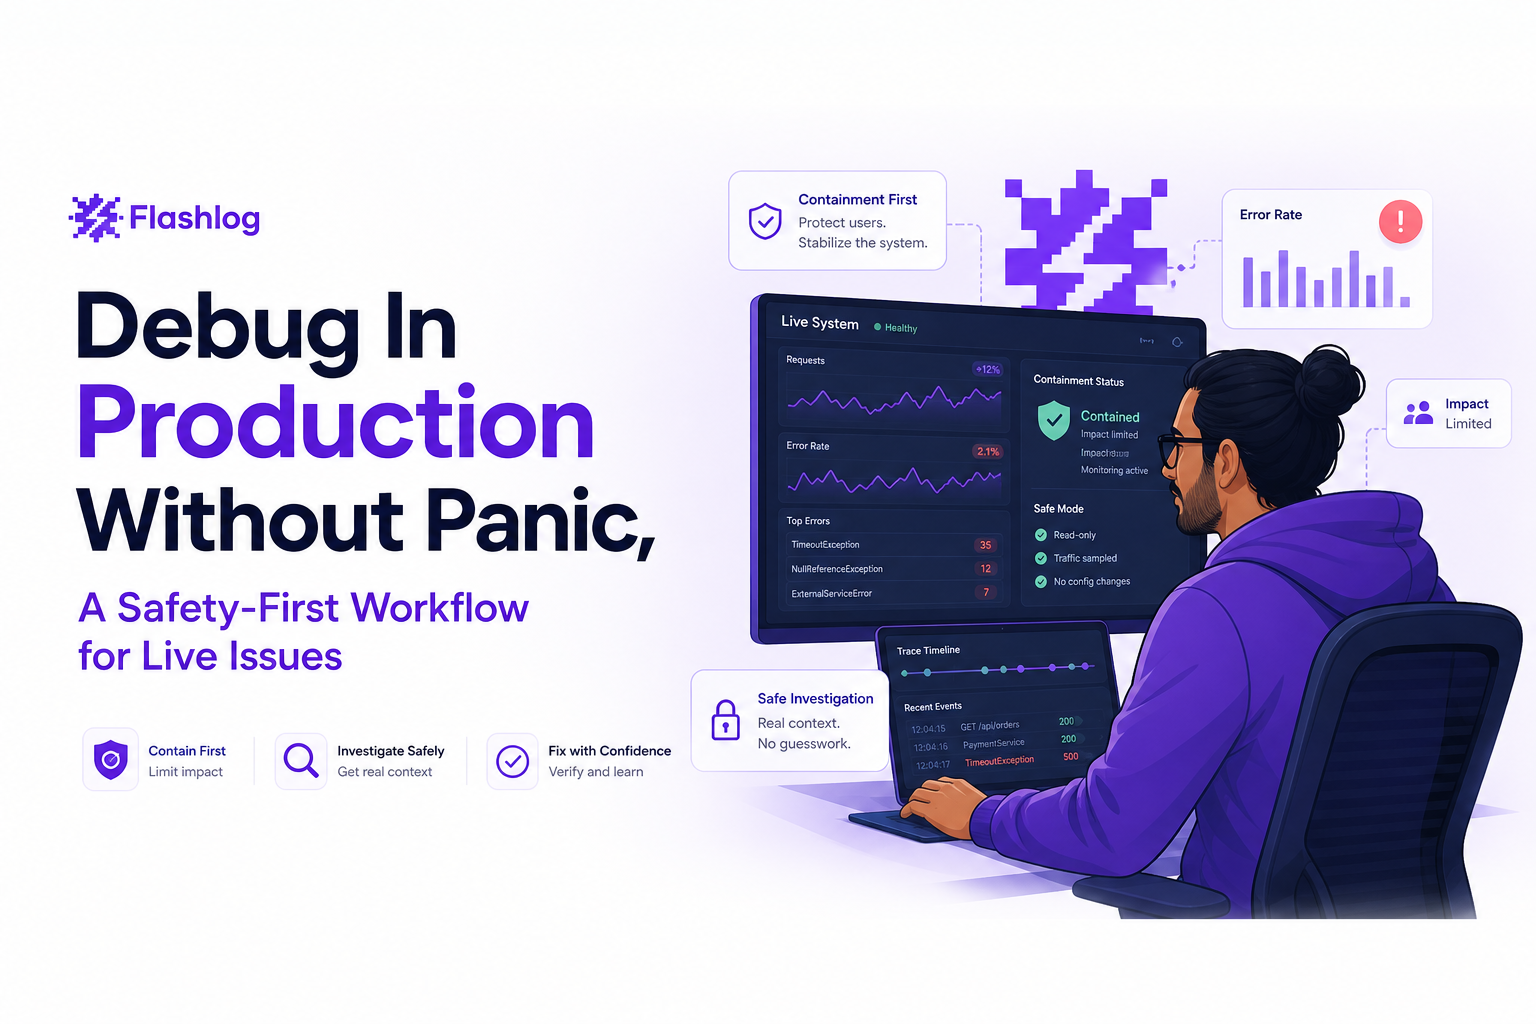
Step 1: Stabilize first (containment before curiosity)
Outcome: user harm stops increasing, and you have time to learn safely.
Most teams lose time because they start investigating before they reduce impact. Stabilization is not “giving up”, it is buying time and protecting customers.
1.1 Choose a containment action using a simple decision table
| Symptom | Best first move | Why it is safe | What to watch |
|---|---|---|---|
| Spike in 500s after deploy | Rollback or redeploy last known good | Reverts unknown changes quickly | Error rate, latency, checkout conversion |
| One feature breaks a key flow | Feature flag off or kill switch | Limits blast radius to that feature | Drop in feature usage, recovery in funnel |
| Issue affects a subset of users | Reduce rollout percentage or segment | Protects most users while preserving signals | Segmented error rate by cohort |
| Downstream dependency failing | Fallback path, circuit breaker, degrade gracefully | Prevents cascading failure | Timeouts, queue depth, saturation |
1.2 Define “stabilized” with two numbers
Write these into the incident channel so everyone aligns:
- Blast radius: % of users impacted (example: “checkout failures down from 18% to <2%”).
- Time-to-clarity target: how long you will spend to identify the likely cause (example: “30 minutes to a top-2 hypothesis list”).
1.3 Stabilization checklist
- Rollback path confirmed (or feature disabled) and verified by a real user journey.
- Error budget: agreed threshold for continuing investigation in prod (example: “no more than +0.5% 5xx over baseline”).
- One owner for comms and one owner for technical decisions.
Step 2: Build a production-grade reproduction contract
Outcome: you can make the bug happen on demand (or at least predict when it will happen) without guessing.
To debug in production effectively, “I saw it once” is not enough. You need a repro contract that is specific enough to instrument and test against.
2.1 Use the 7-field repro contract template
Copy this into your ticket or incident doc:
- Actor: which user type? (new user, paid user, admin, etc.)
- Environment: web/app version, release ID, region, device, browser.
- Entry path: page or deep link, referrer, feature flag state.
- Action: exact click/submit/gesture.
- Expected: what should happen.
- Actual: what happens instead (include status code, error message).
- Frequency: 100%, intermittent, tied to time window or cohort.
2.2 Segment the repro by cohort before adding logs
Do this quick segmentation to avoid instrumenting the wrong thing:
- Release-based: only on web@2.3.1? If yes, suspect deploy artifact, config, or schema mismatch.
- Region-based: only EU? Suspect edge routing, data residency, third-party endpoints.
- Account-based: only certain plans? Suspect authorization, feature entitlements, data shape.
- Device/browser-based: only Chrome 142? Suspect frontend runtime or compatibility.
2.3 Practical example of a repro contract
Actor: paid user
Environment: Chrome 142, macOS, web@2.3.1, US region
Entry path: /checkout from cart, promo applied
Action: click “Confirm order”
Expected: order confirmation page
Actual: spinner then error toast; API returns HTTP 500 on POST /api/checkout
Frequency: ~15% of attempts, higher during peak traffic
Step 3: Observe with targeted instrumentation (not “turn on all logs”)
Outcome: within 10 to 30 minutes, you can narrow to one likely cause with evidence.
The biggest mistake when teams debug in production is turning on broad debug logging. It increases cost, increases noise, and can create privacy risk. Instead, instrument around a single hypothesis and keep scope tight.
3.1 The hypothesis loop that keeps production safe
- Hypothesis: “POST /api/checkout fails because request validation rejects promo payload.”
- Prediction: “Failures will include field X missing or malformed, and only for users with promo applied.”
- Minimal instrumentation: log validation error code + promo flag + request ID (not full payload).
- Decision rule: “If >80% of failures match error code V123, proceed with fix A. Else test hypothesis B.”
3.2 What to collect in production to be ticket-ready
Whether you use logs, traces, or an automated bug capture tool, the “ticket-ready” minimum is:
- Failing request identity: endpoint, method, status, latency, request ID, correlation ID.
- User journey context: last 5 to 20 actions or navigation steps leading to failure.
- Environment: release version, browser/OS/device, region/edge POP if relevant.
- Error evidence: exception type, message, stack trace, or structured error code.
- Impact: number of affected users or events in a time window.
If you want a deeper walkthrough on stitching evidence together, see log correlation.
3.3 Privacy and performance guardrails for instrumentation
- Redact by default: never log raw passwords, tokens, full payment data, or full request bodies.
- Sampling: start at 1% to 5% for high-volume endpoints; raise only if needed.
- Time-box: set an expiry (example: remove extra logs within 24 hours).
For security standards around handling sensitive data in telemetry, align with guidance like the OWASP Top 10 and your internal logging policy.
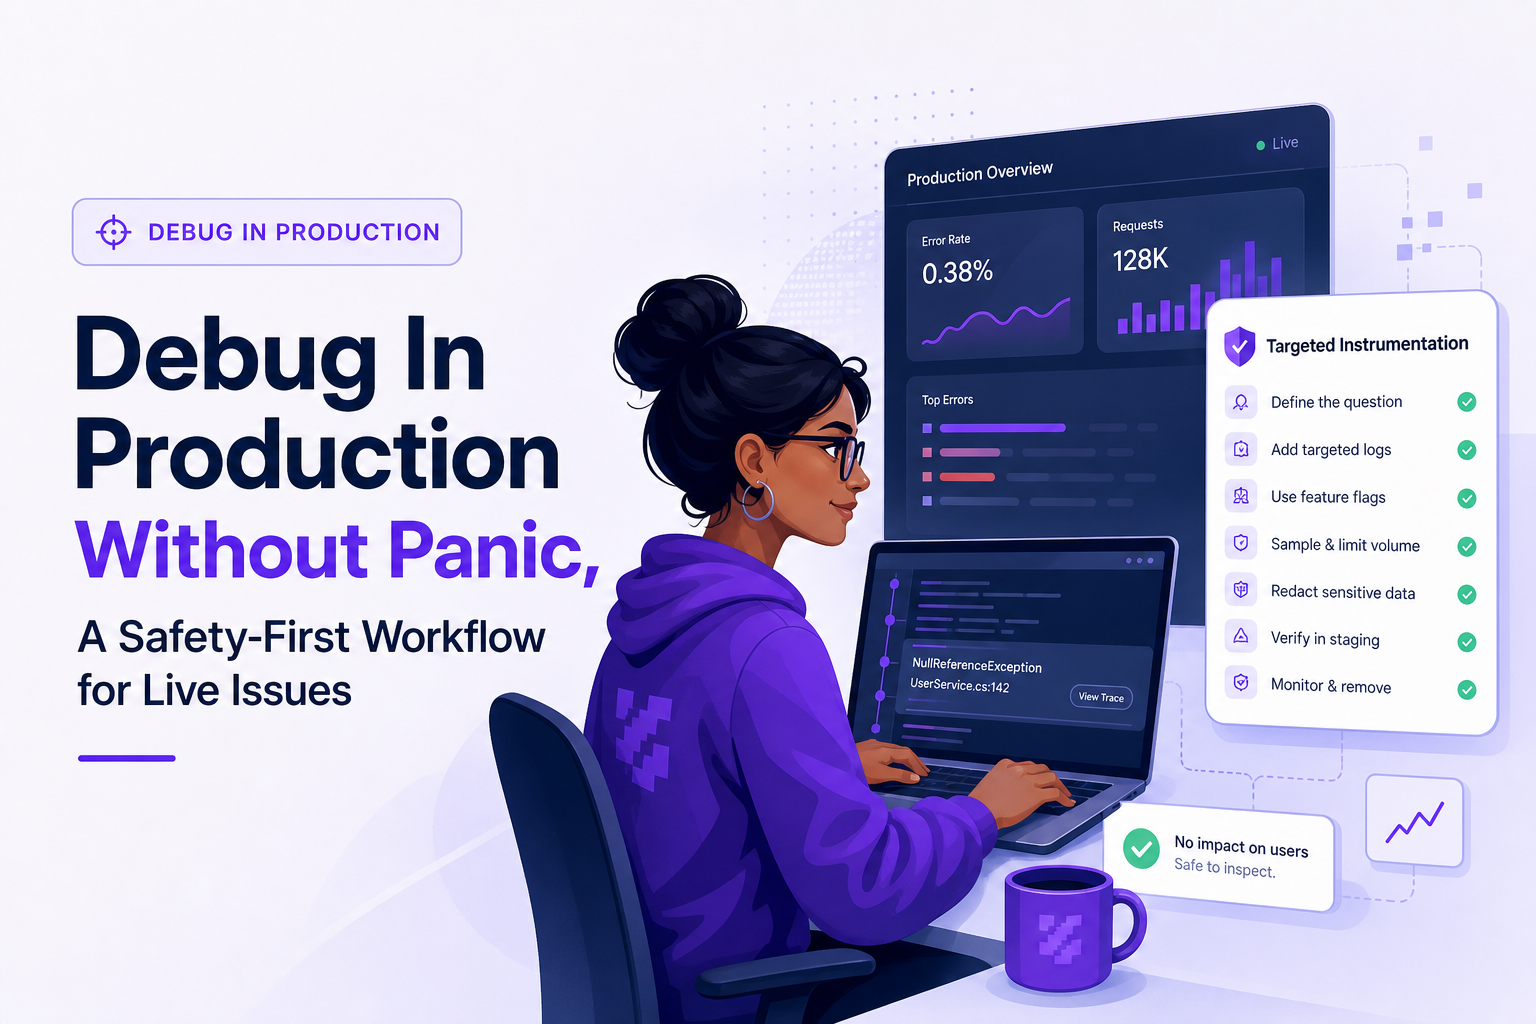
Step 4: Verify the fix with canary, success metrics, and rollback readiness
Outcome: you ship a change that measurably improves user outcomes, and you can revert quickly if it does not.
4.1 Verification is a 3-layer gate
- Layer 1: Functional (does the repro stop happening?) Use the same repro contract fields to confirm.
- Layer 2: Technical (did the signals improve?) Check 4xx/5xx rate, latency p95/p99, crash rate.
- Layer 3: Business (did users recover?) Checkout conversion, signup completion, message send success.
4.2 Canary rollout template
Use this exact sequence to keep risk low:
- Canary 1% for 10 to 20 minutes (or N requests, whichever is larger).
- Compare to baseline using the same time-of-day window from the previous day if traffic is cyclical.
- Expand to 10% if error rate and latency are stable.
- Expand to 50%, then 100%.
- Remove temporary logs and close the loop with a post-incident note.
4.3 Define “fixed” with explicit exit criteria
- Error rate back to baseline (example: 5xx < 0.2% for 60 minutes).
- No new correlated errors introduced (example: payment timeouts not increasing).
- Business metric recovered (example: checkout completion within 95% of last 7-day median).
Common pitfalls when you debug in production
These are the patterns that make incidents longer and riskier, plus the concrete fix for each.
Pitfall 1: Shipping speculative fixes without evidence
- What it looks like: “Maybe it is caching, let’s clear it everywhere.”
- Why it is risky: you change multiple variables and lose causality.
- Fix: one hypothesis, one change, one success metric.
Pitfall 2: Turning on verbose logging globally
- Risk: cost spikes, noise hides the signal, and privacy exposure increases.
- Fix: scoped logging by endpoint + cohort + time-box + sampling.
Pitfall 3: Not capturing the user path into the bug
- Risk: engineering cannot reproduce, so fixes become guesswork.
- Fix: record last actions, navigation history, and failing step. If you are improving your workflow, read this guide on crash reporting.
Pitfall 4: Duplicates overwhelm triage
- Risk: five alerts become five tickets, and nobody trusts the backlog.
- Fix: dedupe by signature (endpoint + error code + stack) and group by release. A lightweight framework helps: issue triage.
Pitfall 5: Misreading stack traces
- Risk: you fix the symptom line, not the upstream cause.
- Fix: anchor on the first application-frame error and correlate with the triggering request and user action. See a stack trace example to practice.
Checklist: a safe, repeatable production debugging runbook
Use this as a copy-paste runbook when you need to debug in production under pressure.
7.1 Stabilize (0 to 15 minutes)
- Confirm impact: affected users %, revenue or key action drop, error rate.
- Contain: rollback, disable feature, reduce rollout, or degrade gracefully.
- Set guardrails: max allowable error increase, time-box for investigation.
7.2 Reproduce (10 to 30 minutes)
- Fill the 7-field repro contract.
- Segment by release, region, cohort, device.
- Identify the “one step” where the journey breaks.
7.3 Observe (15 to 60 minutes)
- Write a single hypothesis with a measurable prediction.
- Add minimal instrumentation with redaction and sampling.
- Correlate request ID across services and confirm the failure signature.
7.4 Verify and ship (30 to 120 minutes)
- Canary rollout with clear success metrics.
- Confirm repro no longer occurs and business metric rebounds.
- Remove temporary logs and document what you learned.
The 6 guardrails that make production debugging fast and low-risk
Outcome: you can debug in production frequently without fear because the system is designed for safe learning.
Guardrail 1: Feature flags with kill switches
- Implementation rule: every user-facing flow that touches revenue or auth should have a flag or fast disable path.
- Operational rule: flags must be reversible without deploy.
Guardrail 2: Scoped rollouts and cohort targeting
- Implementation rule: support percentage rollouts and allowlist cohorts (internal users, beta group).
- Benchmark: if you cannot ship to 1% safely, you will struggle to learn safely.
Guardrail 3: Correlation IDs everywhere
- Implementation rule: propagate request IDs through gateway, backend, queues, and third-party calls.
- Payoff: one failing user session becomes one traceable story.
Guardrail 4: Targeted logging with redaction and expiry
- Implementation rule: log structured fields, not raw payloads.
- Operational rule: time-box debug logs and remove them after verification.
Guardrail 5: Reversible database changes
- Implementation rule: prefer expand and contract migrations, avoid destructive schema changes during incident response.
- Operational rule: if a hotfix requires a risky migration, contain first and schedule a safer change.
Guardrail 6: A single “ticket-ready” incident record
- Implementation rule: every real production failure should produce one deduped issue with repro clues, environment, and impact.
- Payoff: engineering spends time fixing, not reconstructing context from screenshots.
FAQ
If your team wants fewer frantic pings and more ticket-ready context when you debug in production, Flash Log can help by capturing real production failures with the path into the bug, packaging the technical evidence, reducing duplicates, and routing one clean issue into your tracker so engineers can move from “what happened?” to “here is the fix” faster.
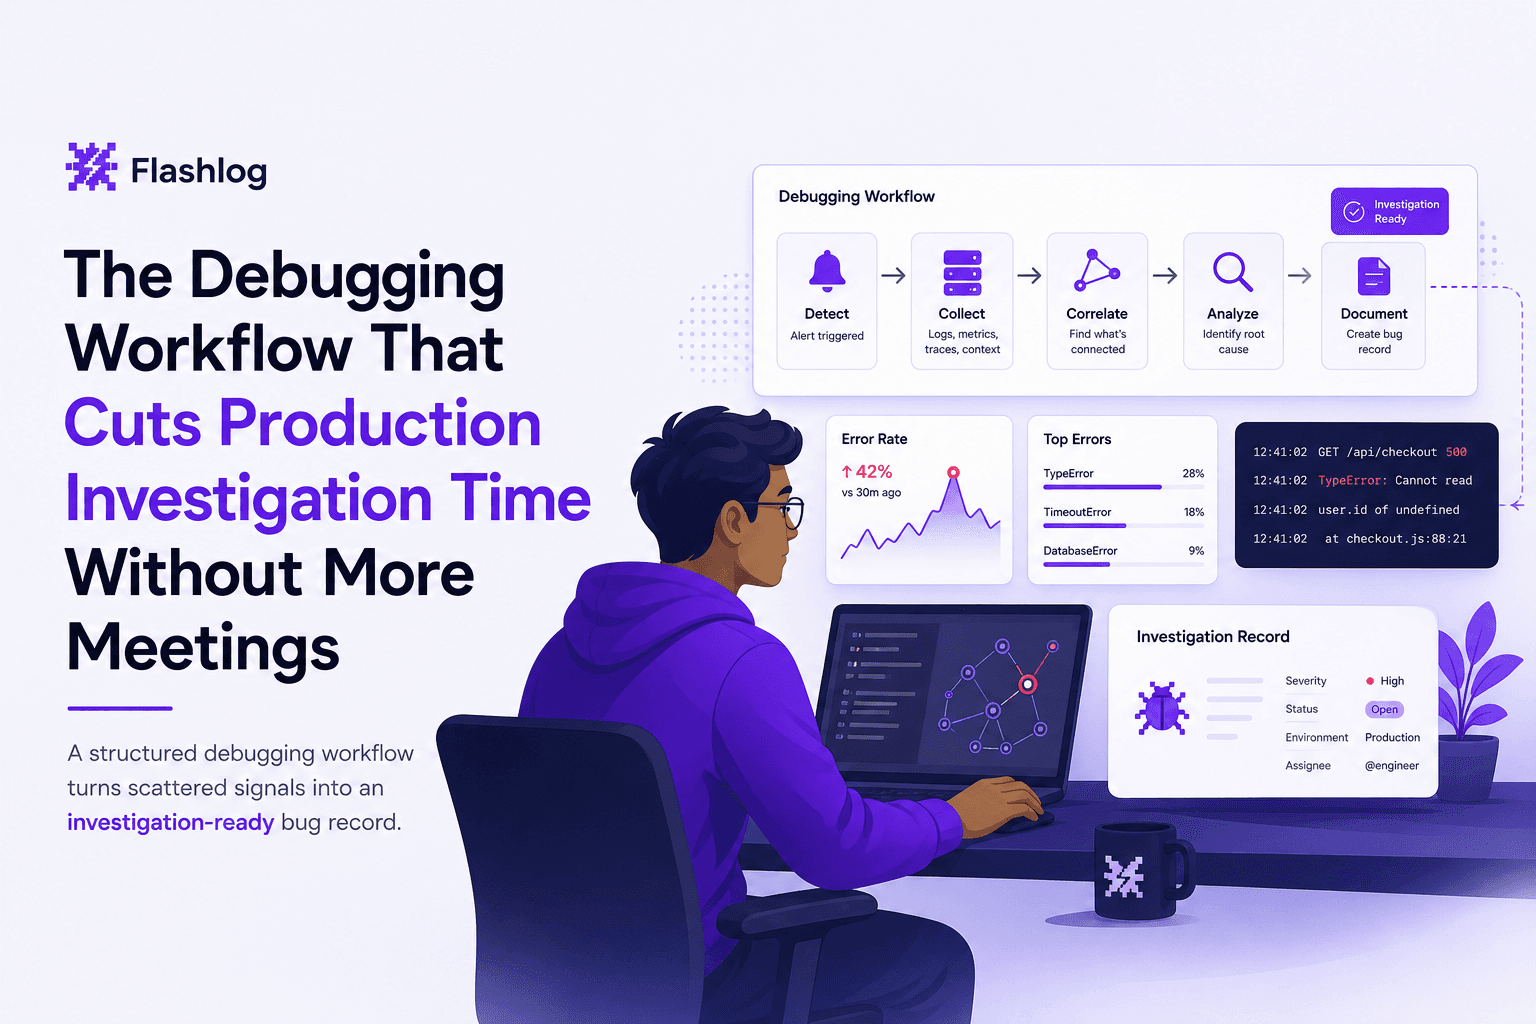
The Debugging Workflow That Cuts Production Investigation Time Without More Meetings
Learn a repeatable debugging workflow to debug production issues faster with clearer signals, faster triage, and less back-and-forth.

Software Bug Tracking System for Support Teams, A Practical Workflow for Catching Bugs Before Users Report Them
A software bug tracking system workflow for support teams: ticket fields, triage rules, AI capture signals, routing, and metrics to cut backlog.
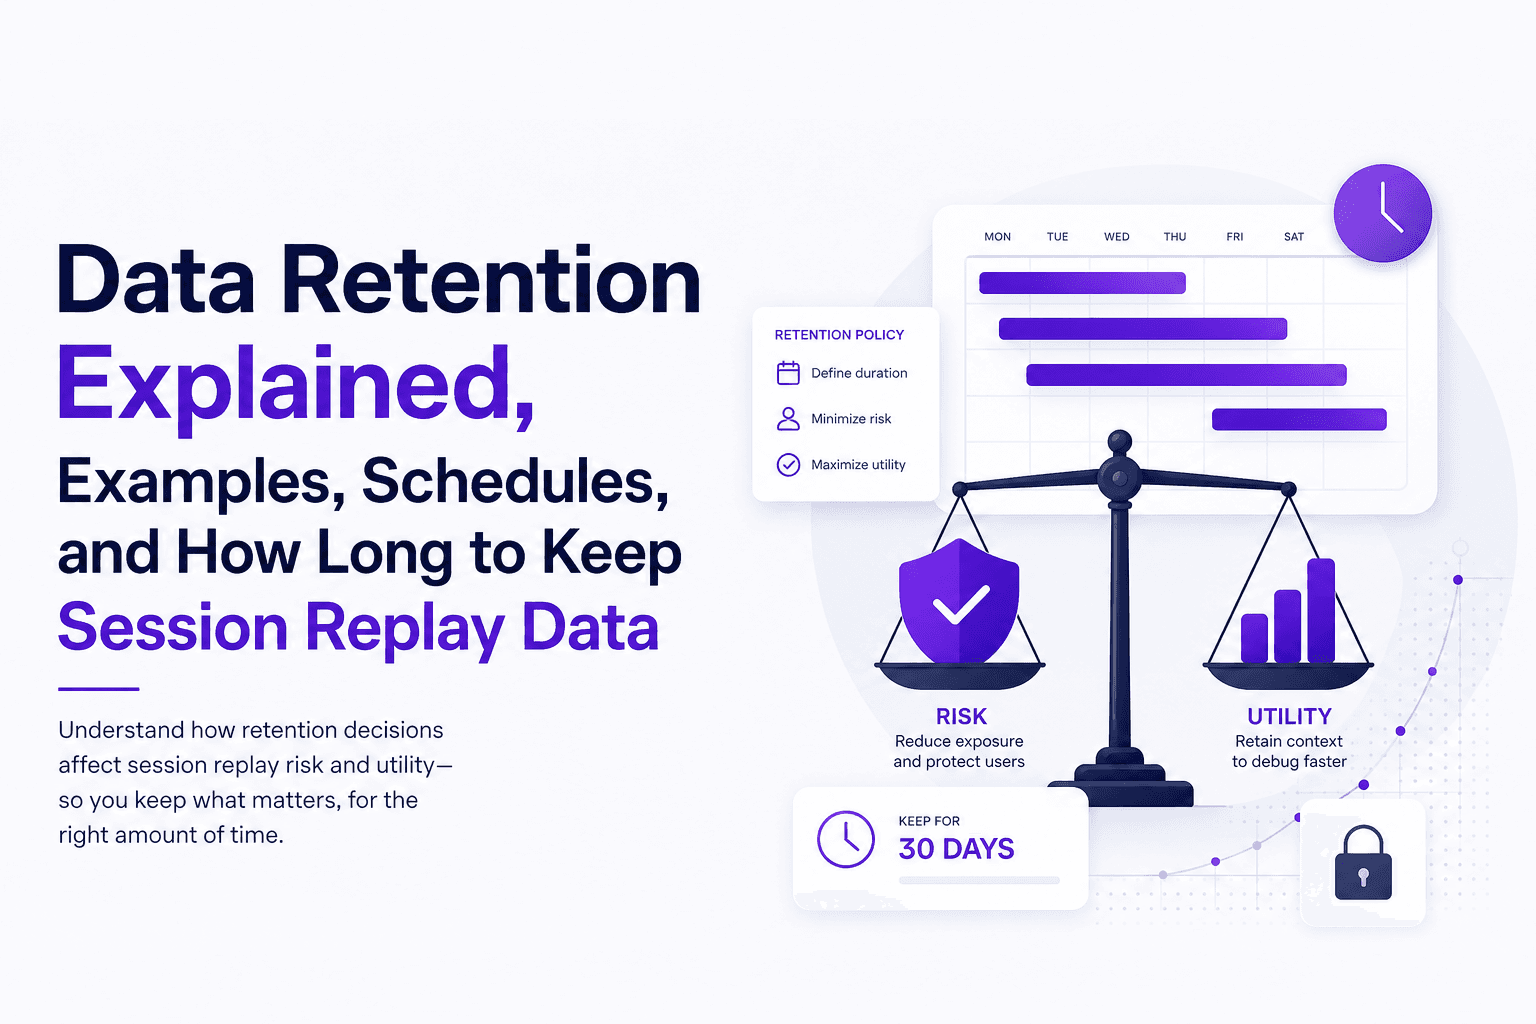
Data Retention Explained, Examples, Schedules, and How Long to Keep Session Replay Data
Learn data retention in plain English, how long to keep session replay data, and a ready-to-use retention schedule template.