
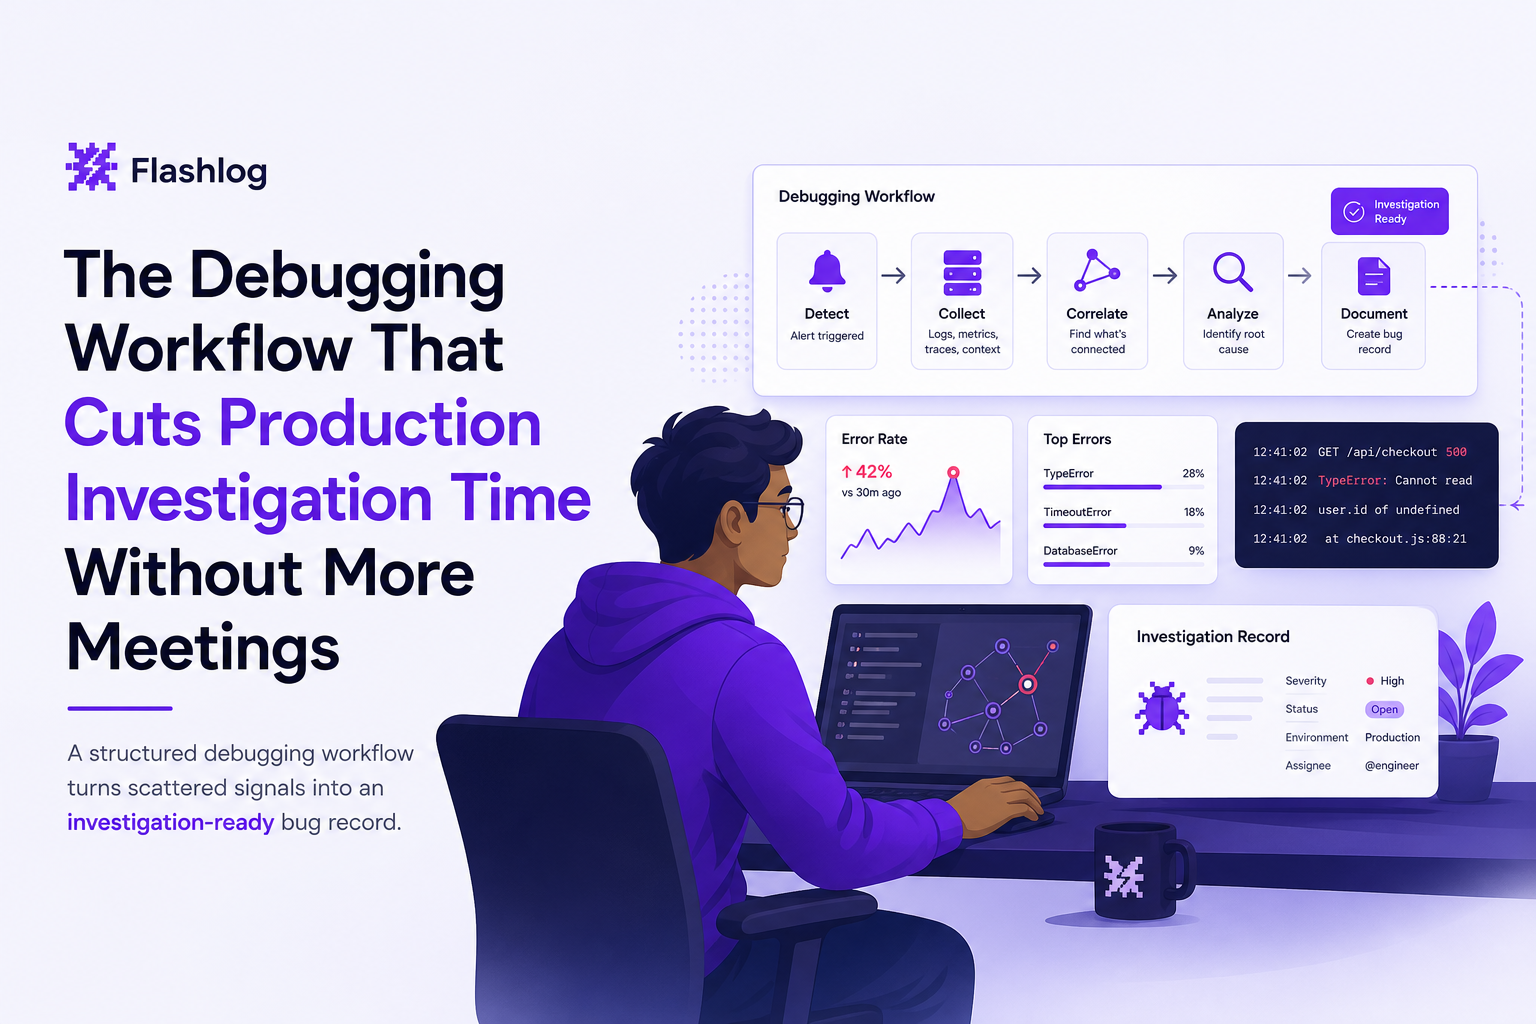
The Debugging Workflow That Cuts Production Investigation Time Without More Meetings
When a production issue hits, most teams lose time before they even start fixing: scattered screenshots, partial logs, unclear repro steps, and five different theories in chat. A repeatable debugging workflow cuts that waste by standardizing what “good input” looks like before anyone touches code. This guide shows an end-to-end system you can run for every incident, from first signal to verified fix, with concrete outputs at each stage so you can reduce time-to-understand without adding more meetings.
- A fast debugging workflow is mainly about time to clarity, not time to patch, and it improves when you standardize inputs (signals, context, hypotheses).
- Use a 5-stage workflow with explicit deliverables per stage: detection, scoping, investigation, validation, and learning.
- Make it stick with lightweight artifacts: a ticket template, a 10-minute triage ritual, and a weekly “top bugs” digest that prevents repeat incidents.
Direct answer what a debugging workflow is and how it speeds production fixes
A debugging workflow is a repeatable sequence of steps and required outputs that turns a raw production failure into a verified fix and a documented learning. It speeds production debugging by (1) capturing the right signals immediately, (2) scoping impact and blast radius early, (3) forcing explicit hypotheses and tests, and (4) validating the fix against the original failure mode. Teams that adopt it typically reduce “time to clarity” from hours to minutes because engineers stop re-collecting context and stop debating from incomplete evidence.
What is a debugging workflow and why most teams do not actually have one
Definition in practical terms
In production, “debugging” is rarely a single activity. It is a chain of handoffs: monitoring to on-call, on-call to feature owner, engineering to support, and back again. A debugging workflow is the agreed-upon chain that answers:
- What counts as a real bug signal? (and what gets ignored)
- What context must be attached? (so engineering can reproduce)
- What decisions happen in what order? (scope first, then dive deep)
- What artifacts are produced? (ticket, timeline, post-incident learning)
Common failure modes that make production debugging slow
Most teams think they have a workflow because they have alerts and a ticketing system. The slowdowns usually come from these specific gaps:
- Signal overload: every 4xx, console error, and “user says it broke” becomes urgent. Engineers spend time sorting noise.
- Missing reproduction path: you know “checkout failed” but not which step, which payload shape, which browser, which release, or which user segment.
- Unscoped blast radius: the team cannot answer “how many users, since when, and on which version,” so priority debates replace investigation.
- Hypothesis thrash: people jump to fixes without a test plan, then ship speculative patches that do not address the root cause.
- No learning loop: the same class of bug returns because nothing changes in detection, logging, or release checks.
What “faster” really means in production
Speed is not only about time-to-fix. In practice, the biggest lever is mean time to clarity: the time from first signal to a high-confidence answer to three questions:
- Is this real? (not an expected edge case or a transient blip)
- Who is affected and how badly? (impact and severity)
- What is the most likely failure point? (where to start investigating)
If you can reach clarity quickly, fixes become straightforward, and you avoid the secondary costs: support escalations, rollback panic, and engineering context switching.
Why a debugging workflow matters for product, engineering, and revenue
The compounding cost of unclear incidents
Production issues are expensive because they create parallel work. While one engineer investigates, others answer pings, support writes workarounds, and a PM tries to estimate impact. A clear debugging workflow reduces that parallel churn by producing a single source of truth early.
Concrete outcomes you can measure
To keep this from becoming “process for process’ sake,” track a small set of metrics tied to the workflow stages:
- Time to clarity: first signal to first ticket with reproduction hints and suspected component.
- Duplicate rate: how many separate tickets represent the same underlying failure.
- Repro success rate: percent of production bugs that can be reproduced within 15 minutes using captured context.
- Escalation volume: number of times engineering must ask for missing details from support or users.
For incident response benchmarks and definitions, many teams align terminology with the Google SRE guidance on incident management and postmortems, even if you do not run a full SRE program.
Who benefits and how
- Engineers: fewer context switches and fewer “can you send more details” loops.
- Support and success: faster, more accurate updates because impact is scoped early.
- Founders and PMs: clearer prioritization because severity is evidence-based, not anecdotal.
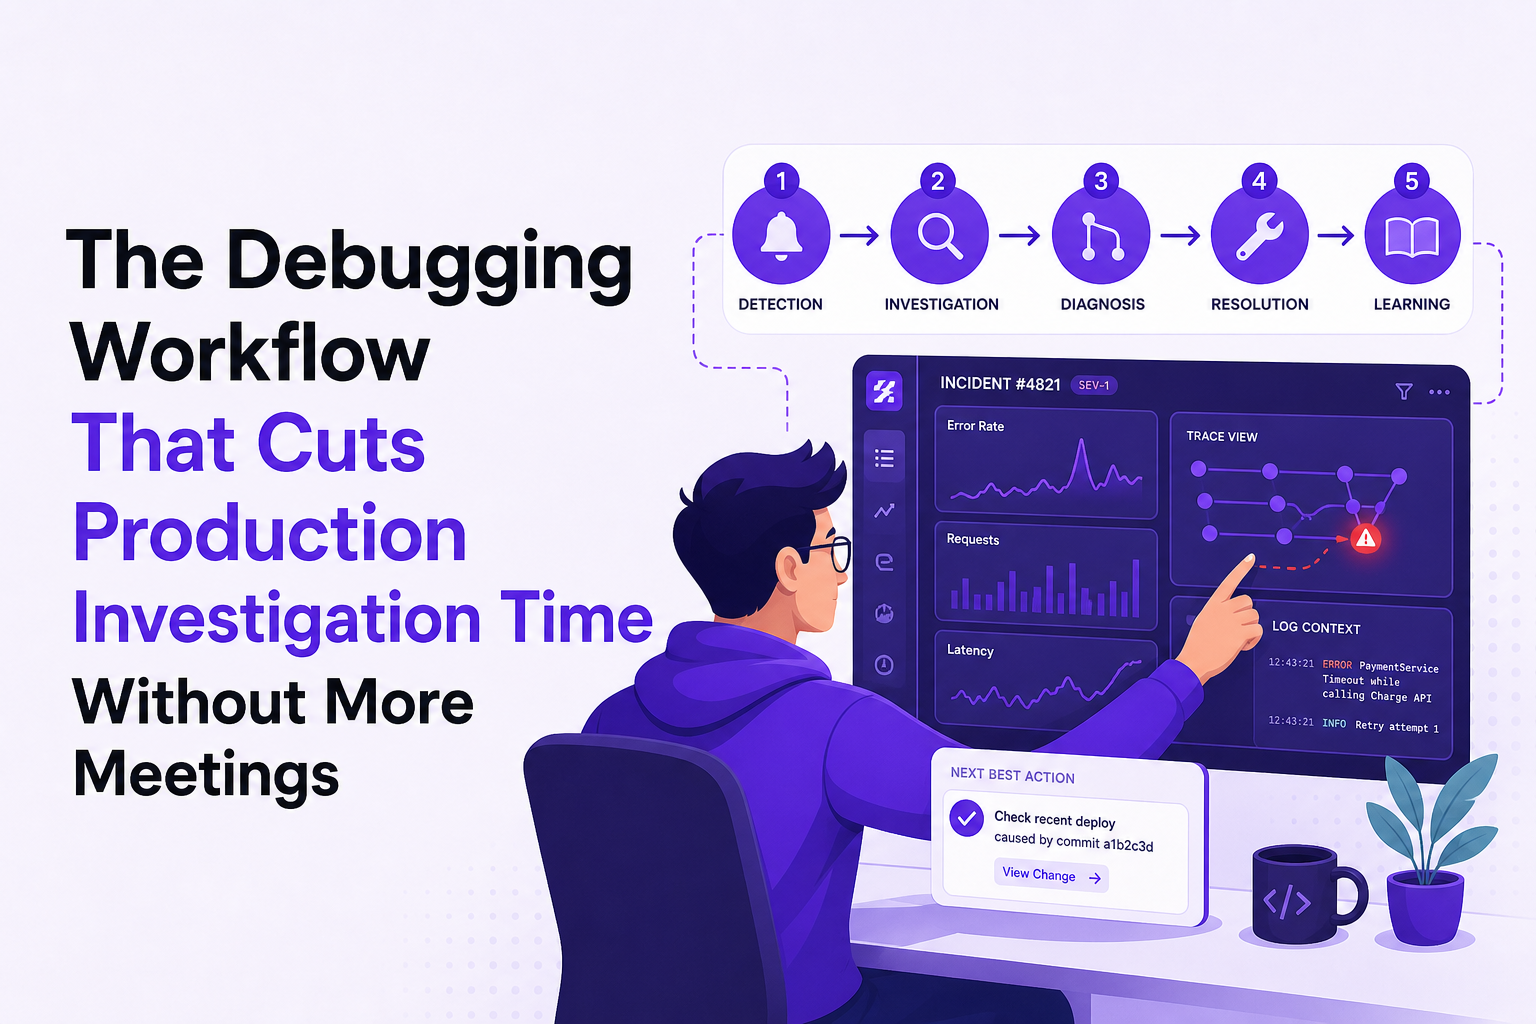
Core framework a 5-stage debugging workflow for production issues
This is the heart of the guide. Each stage has (1) an entry condition, (2) required inputs, (3) a concrete output, and (4) a stop rule so you do not over-invest too early.
Stage 1 Detection and capture from raw signal to actionable record
Goal: capture the failure with enough evidence to investigate later, even if the user never reports it.
Entry condition: a credible signal appears (alert, error spike, user report, failed revenue event).
Required inputs to collect within 5 to 10 minutes:
- Error type and location (API 5xx, frontend exception, realtime/socket close, broken UI action)
- Timestamp window and release version
- Environment (browser, OS, device, region if relevant)
- Minimal user journey: last 3 to 10 actions leading to the failure
Output: a single “bug record” that includes the failing endpoint or UI action, the exact error, and the path into the bug.
Stop rule: do not hypothesize root cause yet. If you cannot answer “what failed” and “where,” keep capturing.
Stage 2 Scoping and severity decide if this is urgent and how big it is
Goal: avoid two common traps: treating everything as critical or underreacting to a real outage.
Entry condition: you have a bug record with a clear failure signature.
Scoping questions (answer with evidence):
- How many users are affected? Count unique users or sessions in a time window.
- Which flows are blocked? Login, checkout, onboarding, realtime updates, etc.
- Is it release-correlated? Did it start after deploy X?
- Is it segment-specific? Browser version, device class, region, account tier.
Output: severity plus blast radius statement, for example: “Critical. Checkout submit returns HTTP 500 for 42 users since web@2.3.1.”
Stop rule: if impact is low and stable, route to normal queue with full context. If impact is high or rising, move to investigation immediately.
Stage 3 Investigation turn context into hypotheses and tests
Goal: move from “something is broken” to “this specific component fails under these conditions” with a short list of testable hypotheses.
Entry condition: you know the failing surface area (endpoint, UI action, socket channel) and scope.
Required investigation artifacts:
- Hypothesis list (max 3): each must be falsifiable.
- Test plan: what log or metric will confirm or refute each hypothesis.
- Correlation key: request id, session id, user id, order id, or trace id you will use across systems.
Example hypothesis set for a checkout 500:
- H1: a missing or misconfigured route after deployment causes POST /api/checkout to hit a default handler and return 500.
- H2: request validation rejects a new payload shape, throwing an unhandled exception.
- H3: downstream dependency timeout triggers a failure path not handled by the API.
To make correlation systematic (not heroic), adopt a simple framework for joining signals across frontend, API, and infrastructure. If you want a deeper method, see log correlation.
Output: a short investigation note: “Most likely cause + evidence,” plus links to the correlated logs/traces.
Stop rule: when one hypothesis has strong evidence, stop exploring and move to a fix plan. Do not keep collecting “nice to have” data.
Stage 4 Validation ship safely and prove the fix matches the failure mode
Goal: confirm the fix addresses the original production failure, not just a guessed reproduction.
Entry condition: you have a suspected root cause and a proposed change.
Validation checklist:
- Reproduce before fix: either locally, in a staging environment, or via a controlled production test that does not harm users.
- Add a guardrail: better error handling, feature flag, or rollback plan.
- Verify after deploy: error signature drops, affected flow recovers, and no new correlated errors appear.
- Confirm with scope metrics: the same user segments and versions improve.
If you must debug in production, define safety rules up front: read-only queries first, rate limits, and a clear abort condition.
Output: a fix record with “before/after” evidence and a link to the deploy or PR.
Stop rule: if the original error signature does not drop, treat it as an incomplete fix and return to investigation with updated hypotheses.
Stage 5 Learning prevent repeats with one small change per incident
Goal: reduce future incidents by improving detection, context capture, or release safety, without writing a long postmortem every time.
Entry condition: fix is verified and stable.
Learning outputs (choose at least one):
- New signal rule: alert on the right symptom (for example, checkout 500 rate) instead of generic error volume.
- New context field: log the missing dimension that slowed you down (payload shape version, feature flag state).
- New test: add a regression test or synthetic check for the broken flow.
- Noise reduction: deduplicate repeated errors or ignore expected business errors.
Output: a short “learning card” appended to the ticket: what happened, why it was slow, what changed to make the next one faster.
Stop rule: cap learning work to 15 to 30 minutes for non-severe incidents. Consistency beats perfection.
| Stage | Primary question | Required output | Target timebox |
|---|---|---|---|
| 1. Detection | What failed and where? | Bug record with failure signature and path | 5 to 10 min |
| 2. Scoping | How big and how urgent? | Severity plus blast radius statement | 10 to 20 min |
| 3. Investigation | What is the most likely cause? | Top hypothesis with evidence and correlation key | 30 to 90 min |
| 4. Validation | Did we fix the right thing safely? | Before/after proof tied to original signature | 30 to 60 min |
| 5. Learning | How do we prevent or speed up next time? | One process or instrumentation improvement | 15 to 30 min |
Common mistakes that break a debugging workflow
Mistake 1 Treating the ticket as the workflow
A ticket is a container, not a process. If the ticket only says “checkout broken,” engineers still need to recreate the missing context. Require specific fields (below) so every ticket is investigation-ready.
Mistake 2 Scoping too late
Teams often dive into logs immediately. The result is 60 minutes of digging followed by “wait, this only affects one browser version.” Put scoping before deep investigation so you spend effort proportional to impact.
Mistake 3 Letting duplicates flood the backlog
Duplicates hide the true number of unique problems and waste triage time. Your workflow should include deduplication rules and a single canonical issue per failure signature. A structured issue triage approach helps teams separate signal from noise in minutes.
Mistake 4 “Fixing” without validation against the original signature
It is common to ship a patch that makes the symptom disappear in one environment but not in production. Always validate using the same error signature, endpoint, and segment that defined the incident.
Mistake 5 No workflow for bugs without a local reproduction
Some failures only happen with real data, real timing, or real user behavior. If you do not have a plan for reconstructing context, these incidents become multi-day investigations. See production debugging without a local repro for a practical approach.
Best practices to make the workflow stick with minimal rituals and artifacts
1 Use a ticket template that enforces “good inputs”
Add a required section to every production bug ticket. Keep it short but non-negotiable:
- Failure signature: error message, status code, exception type
- Surface: endpoint, UI action, socket channel
- Reproduction hints: last steps, expected vs actual
- Environment: browser, OS, device, release
- Impact: affected users count, start time, severity rationale
- Correlation key: request id, session id, trace id
2 Run a 10-minute triage ritual, not a meeting
Schedule a daily or twice-daily 10-minute async-first triage. The purpose is only to produce two decisions:
- Route: who owns investigation and by when.
- Scope: confirm severity and whether to escalate.
Everything else belongs in the ticket. This keeps your debugging workflow lightweight while still consistent.
3 Standardize “evidence links” so anyone can pick up the work
In the investigation stage, require links to the exact evidence used: the log query, trace, dashboard panel, or replay. If you cannot link it, write down the query string and time window.
4 Protect privacy while keeping context
Context often includes payloads and user identifiers. Mask sensitive fields before they leave your environment, and define a policy for what can be stored. For guidance on handling sensitive data, many teams follow principles aligned with OWASP and internal data classification rules.
5 Create a weekly “top bugs” digest for leadership without backlog spam
Founders and PMs do not need every error. They need the few production failures that materially affect users. A weekly digest should list:
- Top 5 user-impacting bugs by severity and affected users
- Time to clarity for each
- What changed to prevent repeats
This reinforces the learning stage of the debugging workflow and makes improvements visible.
Checklist you can copy for your next production incident
Stage 1 Detection checklist
- Identify failure signature (status code, exception, close code)
- Capture timestamp window and release version
- Record environment (browser, OS, device)
- Record last 3 to 10 user actions leading to failure
Stage 2 Scoping checklist
- Count affected users or sessions
- Identify blocked flow and business impact
- Check if release-correlated
- Assign severity with rationale
Stage 3 Investigation checklist
- Write max 3 hypotheses
- Define test per hypothesis
- Choose one correlation key and stick to it
- Link evidence queries and time windows
Stage 4 Validation checklist
- Reproduce before fix (or define safe production verification)
- Deploy with rollback plan or feature flag
- Verify error signature drop and flow recovery
- Confirm no new correlated errors
Stage 5 Learning checklist
- Add one new alert, log field, test, or dedupe rule
- Document “what made this slow” in 3 bullets
- Share in weekly digest
Related guides for debugging production issues faster
- issue triage to find signal fast in under 10 minutes
- log correlation to connect frontend, API, and infrastructure evidence
- production debugging when you cannot reproduce locally
- debug in production safely when the system is live
- crash reporting that turns crashes into fixes engineers trust
FAQ
If you want this debugging workflow to run with less manual effort, tools like Flash Log can automatically capture production failures with the path into the bug, classify and deduplicate noisy signals, and package ticket-ready context so engineering starts from evidence instead of screenshots. Keep the workflow as your system, then let automation fill in the inputs consistently.
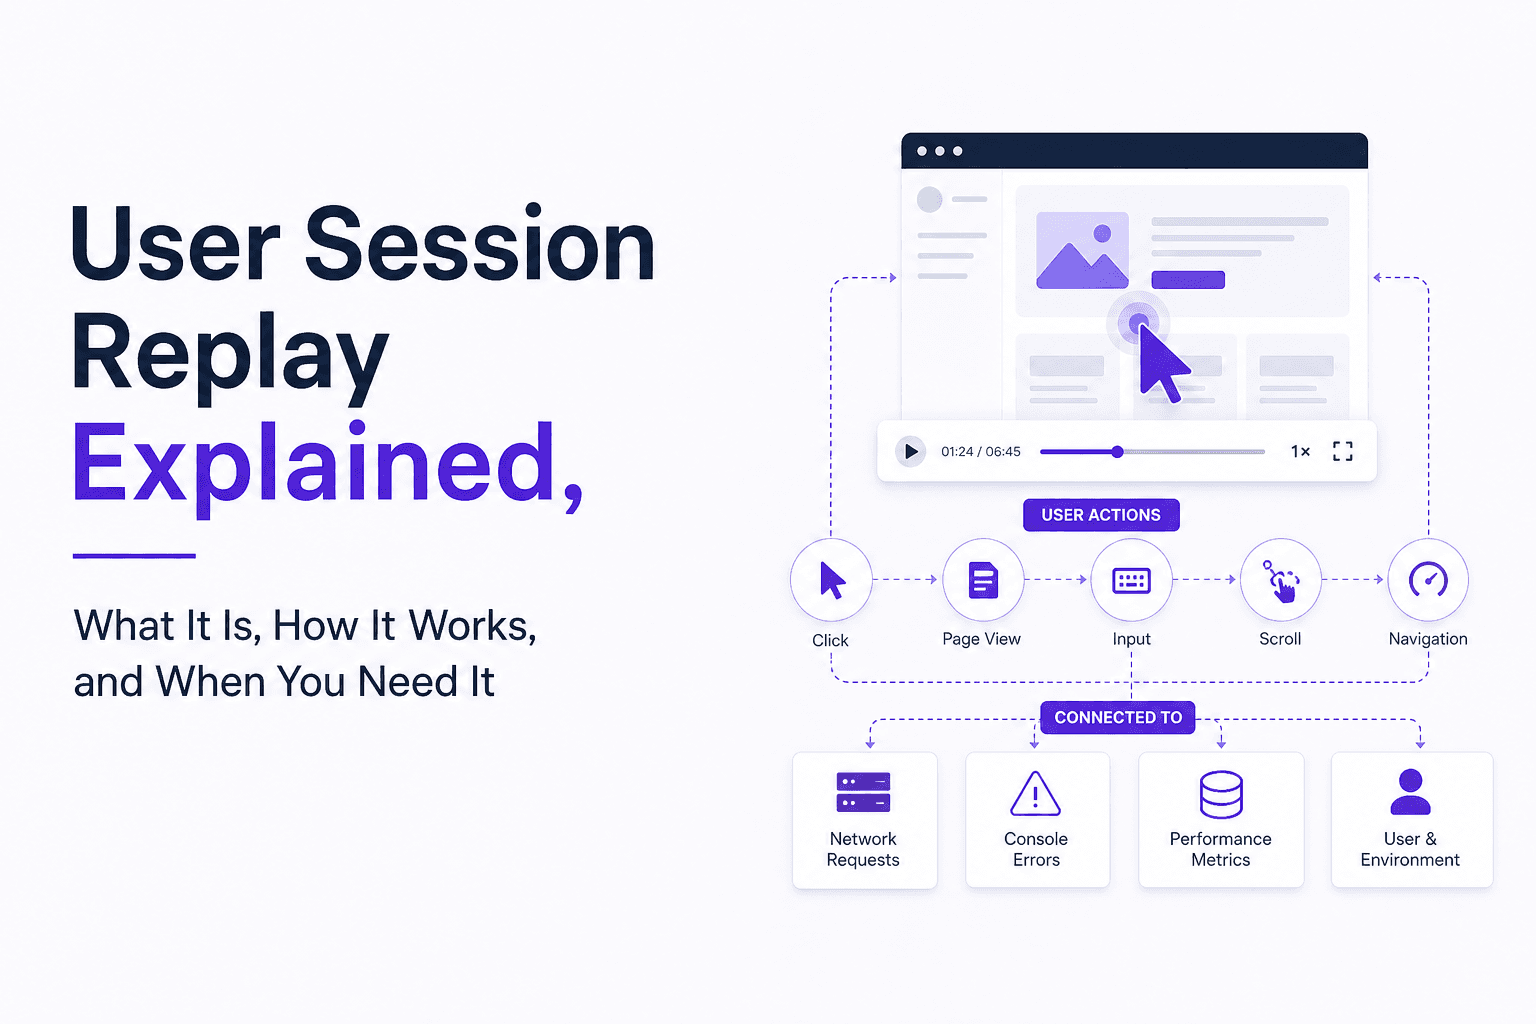
User Session Replay Explained, What It Is, How It Works, and When You Need It
Learn what user session replay is, how it works, what problems it solves, and a checklist to decide if you need user session replay.
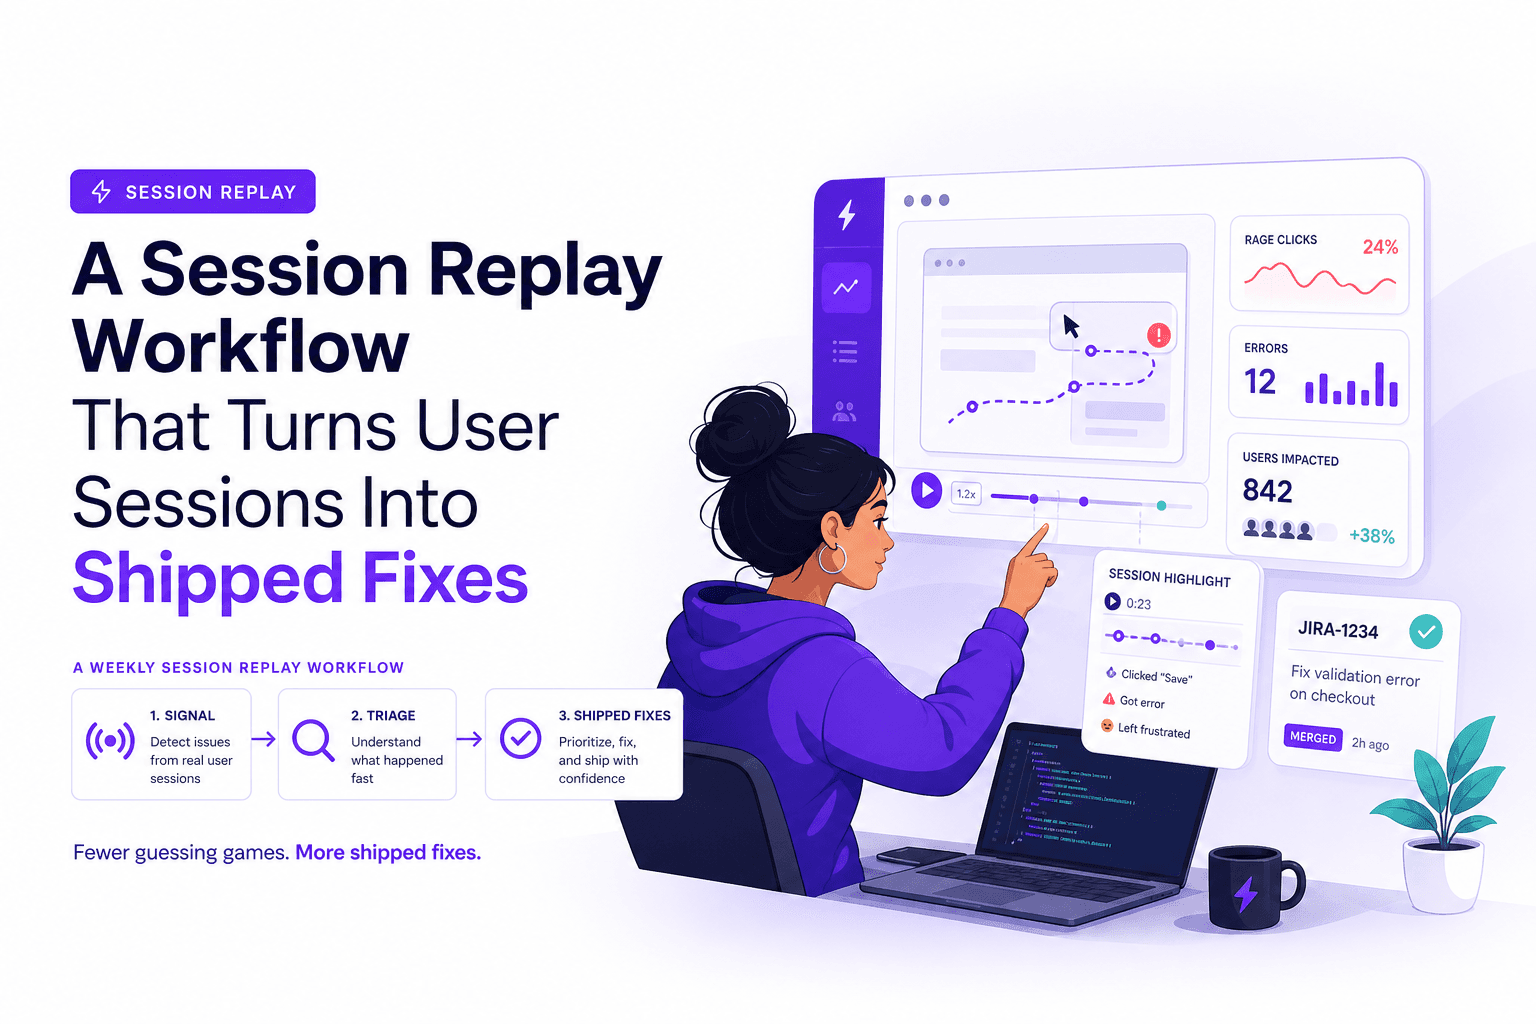
A Session Replay Workflow That Turns User Sessions Into Shipped Fixes
Use session replay as a weekly workflow: triage, tagging, reproduction context, and KPI impact so fixes ship faster with less back-and-forth.
False Positives In AI Systems, How To Measure Them Correctly And Reduce Noise
Learn to measure false positives correctly and apply a practical framework to reduce alert noise without missing real incidents.