
Production Debugging Without a Local Repro - How to Rebuild the Missing Context
Production debugging gets painful the moment a real user hits a failure you cannot reproduce locally: the data is different, the timing is different, the environment is different, and the only “evidence” is usually a vague screenshot or a support message. When local repro fails, teams often thrash: they guess, add random logs, redeploy, and hope. This guide gives you a concrete way to rebuild the missing context, so you can move from “we can’t reproduce it” to “we know what to test next” in under an hour.
- Stop chasing a perfect local reproduction and instead capture “minimal reproducible context” (MRC): who, what, when, where, and what changed.
- Use the same context packet to rank hypotheses quickly and choose the next 2 to 3 debugging actions that reduce uncertainty fastest.
- Prevent repeat thrash by standardizing what gets captured at the moment of failure, including privacy-safe payload snippets and release context.
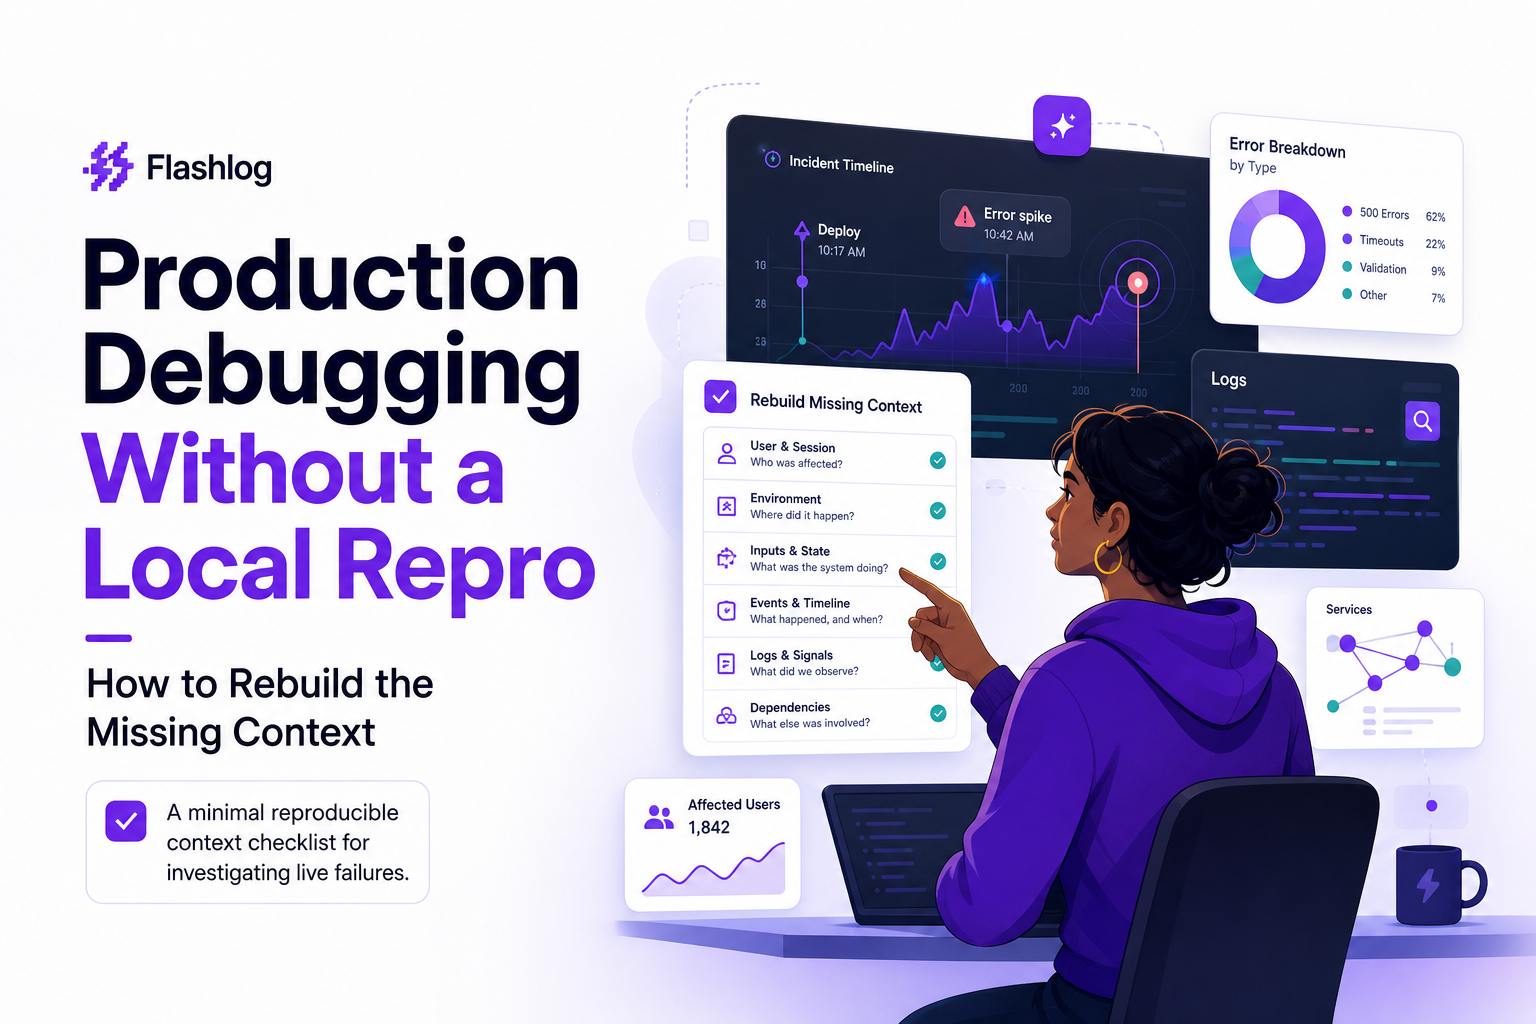
What is production debugging
Production debugging is the process of identifying the root cause of a defect that occurs in a live environment, using evidence from real user sessions, production infrastructure, and deployed code. Unlike local debugging, you typically cannot attach a debugger, cannot freely reproduce traffic patterns, and must work with partial signals like logs, traces, error events, and user-reported steps.
Why local reproduction often fails
- Data shape is different: production records include edge cases, legacy fields, unusual locales, and unexpected nulls.
- Environment is different: CDN behavior, caching, feature flags, third-party scripts, extensions, and device constraints rarely match dev machines.
- Timing is different: concurrency, retries, background jobs, and realtime events create race conditions that do not appear locally.
- Code is different: the exact deployed commit, build artifacts, and configuration can diverge from what you are running.
The practical goal
The goal of production debugging is not “reproduce it locally at all costs.” The goal is to gather enough high-signal context to make the next engineering step obvious: a targeted test, a controlled reproduction in staging, a specific code path to inspect, or a safe fix to ship.
How it works - the Minimal Reproducible Context framework for production debugging
When you cannot reproduce locally, you need a substitute for reproduction: a Minimal Reproducible Context (MRC) packet. Think of it as the smallest set of facts that lets another engineer answer two questions:
- What reality produced this failure? (inputs, environment, timing)
- What changed? (release, config, dependencies)
Below is a five-part MRC checklist you can use for any production debugging scenario. If you capture these consistently, your mean time to clarity drops because you stop re-asking the same questions across Slack, support, and engineering.
MRC checklist (copy and paste)
- WHO: affected user segment and count, not just one user. Include roles, plan tier, geography, and whether it is a new or returning user.
- WHAT: the failing action and the exact failure signature (endpoint, error name, status code, UI state). Include “expected vs actual.”
- WHEN: first seen timestamp, last seen timestamp, and whether it correlates with deploy time, feature flag flips, or traffic spikes.
- WHERE: environment details: app version, commit/build id, browser and OS, device class, network type, region, and any relevant third parties.
- CHANGE: what changed recently: release notes, config changes, dependency bumps, infrastructure changes, or data migrations.
Concrete example MRC packet
Scenario: Checkout submit fails for some users.
- WHO: 42 users affected in the last 2 hours, mostly desktop Chrome, US region, logged-in returning customers.
- WHAT: POST
/api/checkoutreturns HTTP 500 after form completion. UI remains stuck on “Submitting…” with no order confirmation. - WHEN: first seen 10:12 UTC, started 6 minutes after deploy
web@2.3.1. - WHERE: Chrome 142 on macOS, release
web@2.3.1, errors cluster on one backend region. - CHANGE: checkout handler refactor shipped in
web@2.3.1; request validation rules updated.
Even without a local repro, this packet tells you what to inspect first: deploy diff, request validation, and regional backend differences.
How to capture MRC fast (without collecting sensitive data)
For production debugging, engineers often hesitate to capture request payloads because of privacy and compliance risk. The workaround is to capture structured snippets instead of raw data:
- Request shape (field presence, types, lengths), not full values.
- Identifiers that are safe to store (hashed user id, order id, correlation id).
- Allowlisted fields only, with redaction for anything sensitive (email, tokens, addresses).
This is also where tools can help. For example, Flash Log is designed to capture real production failures at the moment users hit them and preserve the path into the bug while allowing sensitive fields to be masked before upload. The key is not “more logs,” it is consistently getting the MRC elements above in one place.
Key benefits of Minimal Reproducible Context
MRC is intentionally simple, but it changes how teams behave under pressure. Here are practical benefits you can expect if you standardize it for production debugging.
1) Faster hypothesis ranking
With WHO, WHAT, WHEN, WHERE, and CHANGE filled in, you can immediately rank likely causes. Example: “started right after deploy” plus “clusters on one region” points to rollout or config drift more than random user behavior.
2) Fewer back-and-forth questions
Most incident threads waste time on missing basics: exact endpoint, release version, timestamps, and environment. An MRC packet reduces repeated requests like “what browser?” or “when did it start?” and turns production debugging into a handoff-able artifact.
3) Better reproduction attempts in staging
Even if local repro fails, staging repro often succeeds if you mirror the right variables: the same feature flag state, the same request shape, the same region, and the same release artifact. MRC tells you which knobs matter.
4) Cleaner issue tracking and less noise
When issues are created without context, teams create duplicates and reopen tickets repeatedly. If your workflow includes issue triage plus an MRC requirement, you get fewer low-quality tickets and faster fixes.
5) Easier cross-team collaboration
Support, product, and engineering can all contribute to MRC. Support can provide WHO and WHEN, product can clarify expected behavior, and engineering can fill WHAT and WHERE. That shared packet keeps production debugging from becoming a single engineer’s memory test.
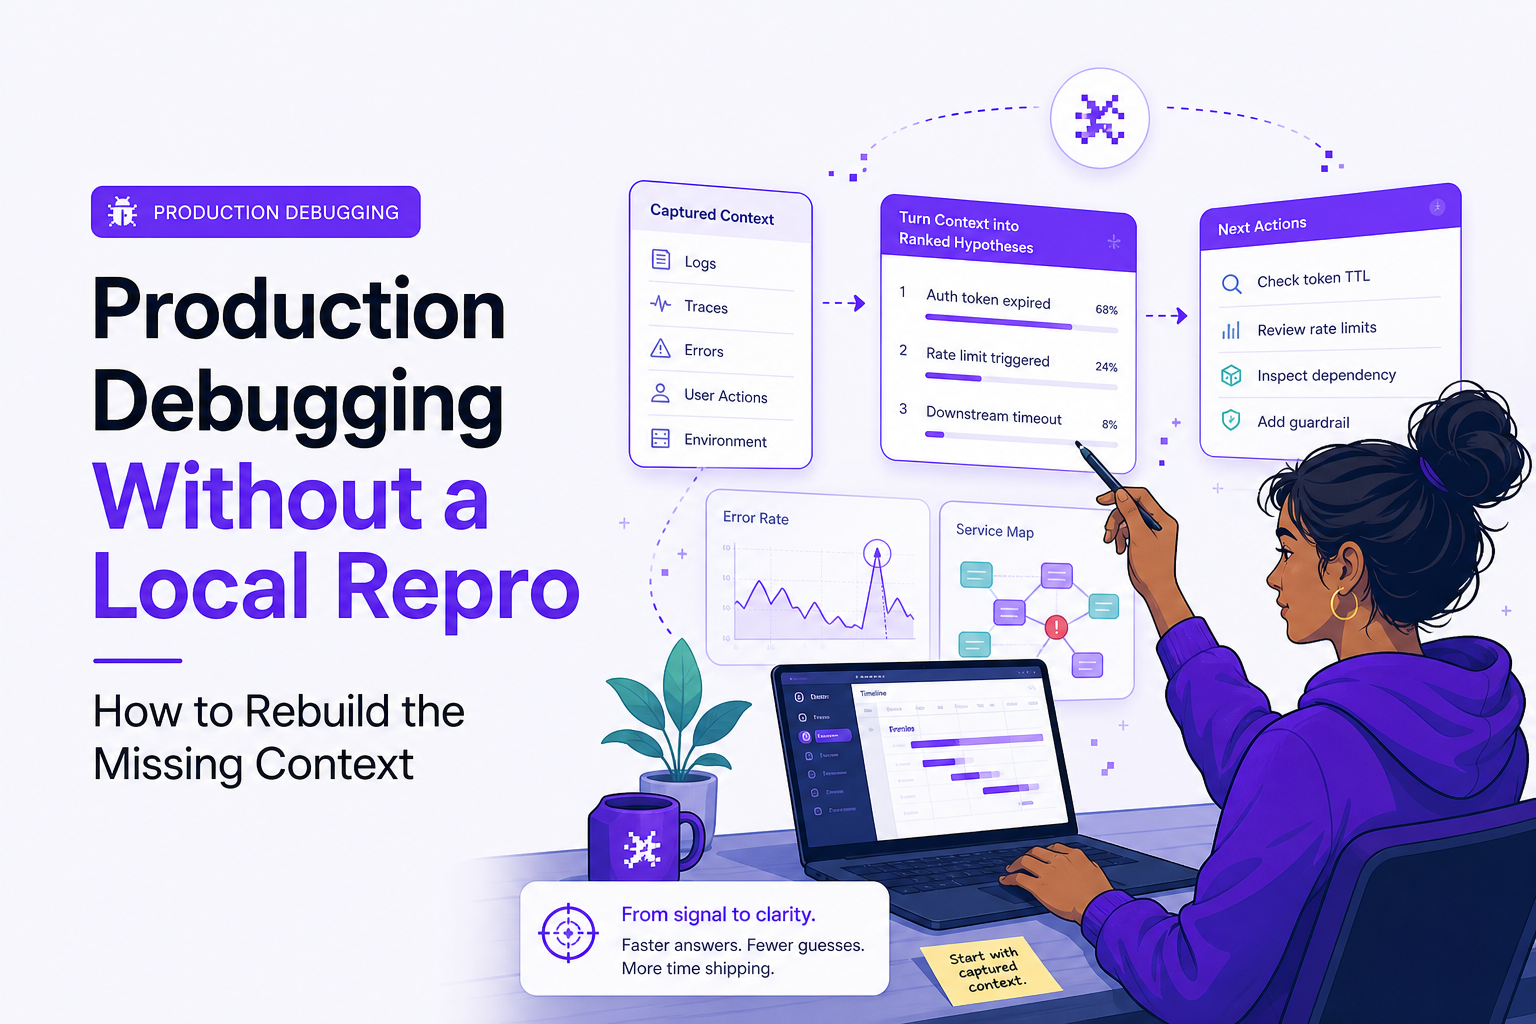
Common mistakes that slow production debugging
Most teams do not fail because they lack smart engineers. They fail because they follow habits that destroy signal. Here are common mistakes, each paired with a concrete correction.
Mistake 1: Treating “cannot reproduce” as a blocker
What happens: the team waits for a perfect repro, so nothing progresses.
Correction: treat MRC as the substitute for repro. If you can answer WHO, WHAT, WHEN, WHERE, and CHANGE, you can take a next step: inspect a specific diff, run a targeted query, or add one precise instrumentation point.
Mistake 2: Adding broad logging everywhere
What happens: you deploy “log everything” changes, create noise, and still miss the one field that matters.
Correction: add instrumentation that maps directly to MRC gaps. Example: if WHAT is unclear, capture the failing endpoint, status, and error class. If WHERE is unclear, capture release id and feature flag state.
Mistake 3: Not pinning the deployed version and config
What happens: engineers debug the wrong commit or assume config matches staging.
Correction: include build id, release tag, and flag snapshot in every bug record. If you do debug in production, this is the minimum to avoid chasing ghosts.
Mistake 4: Ignoring blast radius
What happens: you spend 2 hours on a bug that affects one edge case while a wider outage grows.
Correction: always attach impact: affected users, error rate, and what user journey is blocked. Even rough counts are enough to prioritize the next 30 minutes.
Mistake 5: Losing the user path into the failure
What happens: you know an endpoint failed, but not the sequence of actions that led to it.
Correction: capture the navigation and action trail for the last 10 to 20 events before failure. This is often the difference between a dead end and a reproducible flow. If crashes are involved, pairing this with disciplined crash reporting helps ensure you do not only see the crash, but also the lead-up.
From context to fix - narrow hypotheses in 30 minutes
This is the part most guides skip. Once you have MRC, you still need a fast method to convert it into actions. The workflow below is designed for the first 30 minutes of production debugging when you cannot reproduce locally.
Step 1: Classify the failure signature (2 minutes)
Put the incident into one primary bucket based on WHAT:
- Network/API: 4xx/5xx, timeouts, slow endpoints
- Frontend runtime: uncaught exceptions, blank screens, broken UI actions
- Realtime: socket disconnects, rejected payloads, subscription failures
- Data/consistency: wrong totals, missing records, stale reads
This bucket determines the first evidence you should pull.
Step 2: Build a “top 5 hypotheses” list using a scoring rubric (8 minutes)
Create 5 plausible causes. Then score each hypothesis 0 to 2 on three criteria. Total score 0 to 6.
- Fit: does it explain WHO, WHAT, WHEN, WHERE?
- Change proximity: is it tightly linked to recent CHANGE?
- Testability: can you confirm or falsify it in 10 minutes?
Example hypotheses for the checkout 500:
- Request validation rejects a new field shape for returning users (Fit 2, Change 2, Testability 2 = 6)
- Route not deployed in one region due to partial rollout (Fit 2, Change 2, Testability 1 = 5)
- Database migration missing index causing timeouts that surface as 500 (Fit 1, Change 2, Testability 1 = 4)
- Third-party payment provider intermittent failures (Fit 1, Change 0, Testability 2 = 3)
- Browser-specific frontend bug sends malformed payload (Fit 1, Change 1, Testability 1 = 3)
Pick the top 2 by score. This prevents “try everything” behavior.
Step 3: Run two fast falsification tests (15 minutes)
Choose tests that reduce uncertainty fastest. Good falsification tests are narrow and decisive:
- Diff test: inspect the exact code path touched by the last deploy that maps to the failing endpoint.
- Shape test: compare request shapes between failing and successful attempts (field presence, types, lengths).
- Region test: compare error rates by region or pod to detect partial rollout or config drift.
- Flag test: check if failures correlate with a feature flag state.
If your evidence is fragmented, use a single correlation id across layers to pull a complete story. (If you want a dedicated method for that, see log correlation.)
Step 4: Decide fix type using a decision table (5 minutes)
Once the top hypothesis is supported, decide the least risky fix that restores users fastest.
| Evidence pattern | Likely cause | Fastest safe fix | Follow-up |
|---|---|---|---|
| Started right after deploy; only on one region | Partial rollout or config drift | Rollback region or redeploy consistently | Add deploy verification and config parity check |
| Only certain user segment; request shape differs | Validation or serialization edge case | Relax validation or handle null and legacy fields | Add contract tests and payload shape monitoring |
| Error spikes with traffic; timeouts increase | Performance regression or missing index | Hotfix index or reduce query cost | Add SLO alerts and query profiling |
| Browser-specific failures; frontend exception | Client-side compatibility bug | Patch and ship client fix; add guardrails | Add targeted browser coverage and runtime error grouping |
Step 5: Convert the outcome into a reusable “context template” (optional but high leverage)
After the incident, update your MRC template with the one missing field that would have saved the most time. Over a few incidents, this becomes a team standard for production debugging, and new engineers ramp faster because they know exactly what “good context” looks like.
FAQ
If you want to operationalize this approach, Flash Log can help by automatically capturing real production failures with the surrounding context, grouping noise, and producing a ticket-ready summary so your team spends less time assembling evidence and more time fixing the bug. Use it as a way to consistently collect Minimal Reproducible Context for production debugging, especially for issues users never report.
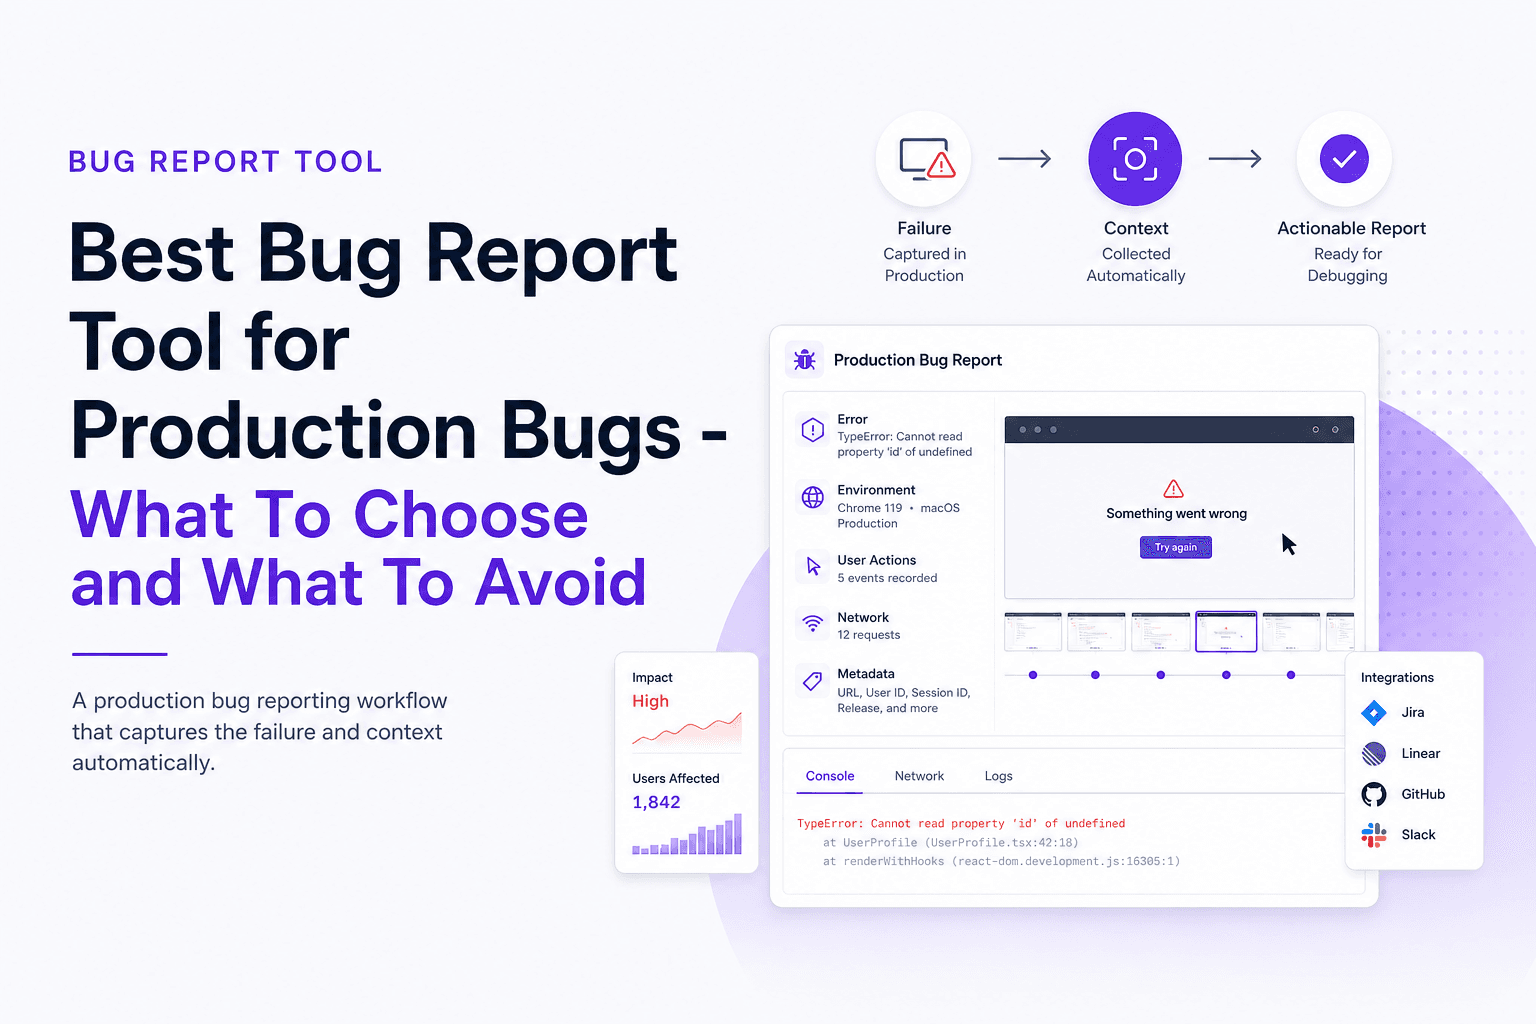
Best Bug Report Tool for Production Bugs - What To Choose and What To Avoid
Choose the best bug report tool for production bugs in 2026 with a 7-day trial scorecard, shortlist options, and common pitfalls to avoid.
False Positives In AI Systems, How To Measure Them Correctly And Reduce Noise
Learn to measure false positives correctly and apply a practical framework to reduce alert noise without missing real incidents.
Alert Triage for On-Call Teams, A Practical Framework For Reducing Noise And Escalations
Learn alert triage methods for on-call teams to reduce noise, improve escalation decisions, and build faster incident response workflows.