
False Positives In AI Systems, How To Measure Them Correctly And Reduce Noise
False positives in AI systems are best reduced by measuring the right probability (how often a “positive” is actually wrong) and then applying a repeatable triage and tuning loop that accounts for prevalence, thresholds, and confirming signals.
- False positive rate is not the same as the chance a positive is wrong; prevalence drives the difference.
- Use a repeatable triage checklist: validate inputs, add context, estimate prevalence, require confirming signals, then decide escalation.
- Reduce noise sustainably with thresholds, allowlists, correlation, and drift monitoring, and measure impact with precision-recall and cost.
False positives, false positive rate, and the chance a positive is wrong
False positive rate can be low while most alerts are still false positives when the underlying event you are looking for is rare.
A single confusion-matrix view you can reuse
Use the same confusion matrix across product bugs, fraud, security detections, or safety classifiers:
- TP (true positive): flagged and truly positive
- FP (false positive): flagged but actually negative
- TN (true negative): not flagged and truly negative
- FN (false negative): not flagged but actually positive
Two ratios that teams routinely mix up:
- False positive rate (FPR) = FP / (FP + TN). This is “how often we cry wolf on normal cases.”
- False discovery rate (FDR) = FP / (FP + TP). This is “given we raised an alert, how likely it’s wrong.”
If your workflow pain is “engineers keep chasing noise,” FDR (or precision = TP/(TP+FP)) usually tracks that pain better than FPR.
The conditional-probability trap in natural frequencies
Natural-frequency math keeps the discussion operational. Suppose:
- Prevalence of the real condition is 1 in 1,000 (0.1%).
- Sensitivity (TPR) is 90%.
- False positive rate is 1%.
Out of 100,000 events, around 100 are truly positive. You detect 90 of them (TP=90). Out of 99,900 negatives, 1% get flagged (FP≈999). Now most “positives” are wrong: precision = 90 / (90+999) ≈ 8.3%. In other words, about 92% of alerts are false positives even though the FPR is “only” 1%.
Operational implication: if the base rate is tiny, reducing false positives often requires either a much lower FPR, better prevalence targeting (segmenting), or adding confirming signals before creating work.
A repeatable triage framework for any suspected false positive
A suspected false positive should be triaged with a fixed sequence that separates “bad input,” “expected behavior,” and “real issue with weak evidence” before you tune the model.
Step 1: Validate inputs and instrumentation first
Before arguing about thresholds, verify the detector saw the right thing:
- Schema and parsing: was the field missing, truncated, or mapped to the wrong enum?
- Time alignment: are event timestamps consistent across services, regions, and queues?
- Sampling and aggregation: did a rollup job over-count retries or merge different entities?
- Identity joins: are you correlating by user, session, device, IP, build, or request id correctly?
When we audited noisy detections in production pipelines, the fastest “false positives” to remove were actually instrumentation artifacts: duplicated events on retry, mismatched status normalization, and missing context fields that made benign flows look anomalous.
Step 2: Reconstruct context and intent
A flag is often correct in isolation but wrong in context. Require a minimal context bundle before calling something a false positive:
- What was the user trying to do? (journey step, API endpoint, feature flag state)
- What changed? (deploy hash, config, dependency version, policy update)
- What was the impact? (blocked checkout, degraded latency, partial failure, harmless warning)
If your system cannot attach this context at alert time, you are structurally biased toward false positives because responders must infer intent and usually assume the worst.
Step 3: Estimate prevalence in the right slice
Prevalence is rarely global. Recompute it in the segment where the model is firing:
- By endpoint or transaction type (login vs checkout)
- By tenant tier (free vs enterprise)
- By geography or ASN (regional payment rails, corporate proxies)
- By client version (new release vs long tail)
Use this rule: if you cannot state prevalence for the slice, you cannot interpret the probability a positive is wrong, and you will misdiagnose false positives as “model quality” instead of “wrong population.”
Step 4: Require at least one confirming signal
Introduce a confirmation gate so a single weak signal does not page humans. Examples:
- Correlation: require the flag plus a correlated symptom (error budget burn, exception spike, conversion drop).
- Temporal consistency: require recurrence across N users or M minutes.
- Cross-source agreement: client error plus server error, or model A plus rule B.
In our experience, adding a simple “two-signal” rule for on-call paging reduced false positives without touching the underlying model, because it filtered one-off anomalies and logging glitches.
Step 5: Decide the workflow outcome, not just the label
End triage by choosing an operational outcome:
- Ignore: expected business response (rate limit, validation failure, payment declined).
- Group: same root cause repeating, track as one issue with an occurrence counter.
- Hold: low-confidence signal, collect more evidence without creating a ticket.
- Escalate: actionable, high-confidence, user-impacting.
This is also where internal runbooks connect naturally to alert triage and consistent issue triage so teams respond to the same evidence standard every time.
AI and cybersecurity false positives, the highest-leverage fixes
False positives drop fastest when you combine thresholding with policy-based allowlists, event grouping, and correlation across signals instead of trying to “model your way out” of everything.
1) Thresholds by segment, not one global cutoff
A global score threshold assumes the same base rate across all traffic, which is rarely true. Practical pattern:
- Higher threshold for high-volume, low-risk endpoints (public assets, health checks)
- Lower threshold for low-volume, high-impact actions (admin changes, payout creation)
Document the segment definitions so you can audit where false positives concentrate after each change.
2) Allowlist expected failures with explicit rules
Many “alerts” are policy decisions masquerading as anomalies. In security and application reliability alike, permission denials, validation failures, and rate limits often represent expected enforcement. Use explicit ignore rules keyed by endpoint, status, error code, and flow so responders do not repeatedly re-triage the same false positives.
3) Collapse duplicates to avoid alert storms
Duplicate events convert one problem into 100 interruptions. Group by a stable fingerprint (stack trace signature, endpoint + error code, normalized exception type) and keep a live occurrence count. This is one of the simplest ways to tame an alert storm without lowering sensitivity.
4) Route low-confidence to review queues, not pagers
Separate “notify” from “record.” A low-confidence model decision can be stored, clustered, and sampled for review, while only high-confidence, high-impact issues page humans. This preserves learning data while cutting false positives that burn on-call attention.
How to reduce false positives without increasing missed alerts
Reducing false positives without missing real issues requires choosing thresholds using precision-recall and an explicit cost model rather than optimizing a single metric in isolation.
Use a cost table to pick trade-offs
Write down the operational cost of each outcome in your environment. Example structure (fill in your numbers):
- FP cost: minutes of engineer time, interruption cost, downstream ticket noise
- FN cost: incident impact, customer harm, security exposure, SLA penalties
- TP value: avoided downtime, fraud prevented, bugs caught pre-escalation
Then choose thresholds that minimize expected cost per day, not just FPR. This is also how you justify why you are willing to tolerate some false positives for high-severity classes.
Monitor before and after with a small set of durable metrics
After any tuning, watch for regression using metrics that map to pain:
- Precision (or FDR): how many positives are false positives
- Recall: how many real positives you still catch
- Time-to-triage: median minutes from alert to disposition
- Alert-to-issue ratio: how many alerts become one actionable issue
What surprised our team was how often “false positives got better” while the real problem got worse: teams reduced alert volume by raising thresholds, but incident reviews later showed more missed detections. Putting precision and recall on the same dashboard prevented that failure mode.
Keep the evidence chain intact
If responders cannot reproduce the flagged behavior quickly, they will label it a false positive by default. Tighten the handoff by attaching enough context for fast validation, and standardize reproduction steps for product issues so the “is it real?” question is answered consistently.
Noise reduction techniques that sustain low false positives over time
Sustaining low false positives is a lifecycle problem, so you need drift checks, feedback loops, and policy reviews that prevent the system from sliding back into noise.
Drift monitoring tied to segments
Track the distribution of key features and scores over time, but do it by the same segments you used for thresholding. If a segment’s base rate changes, yesterday’s threshold becomes today’s generator of false positives. Common triggers:
- New client release changes error patterns
- Bot traffic shifts request mix
- Policy changes increase expected denials
Feedback loops that produce usable labels
Labels fail when they are ambiguous or expensive. To keep improvement continuous:
- Use a small set of dispositions (ignore, duplicate, low confidence, actionable) and define them in writing.
- Sample across segments so you do not only label the loudest area.
- Audit disagreement between reviewers as a signal that your labeling policy is underspecified.
Change management for allowlists and rules
Treat ignore rules like code: version them, require owners, and review them on a schedule. Rules that never expire can hide real incidents, while rules that are too narrow fail to prevent recurring false positives. A practical middle ground is to attach an expiration date or a review-by date to each rule.
Close the loop with workflow metrics
Noise reduction is only successful if it improves throughput and decision quality. Track at least one workflow metric alongside model metrics, such as “weekly alerts that required human action” and “grouped occurrences per issue.” If you are also trying to reduce bug reproduction time, the same context-capture discipline that cuts false positives will usually shorten investigations.
| Lever | Best when | Reduces false positives by | Primary risk | How to monitor |
|---|---|---|---|---|
| Segmented thresholds | Base rates differ by endpoint, tenant, or action | Aligning cutoffs to prevalence | Hidden recall loss in low-volume segments | Precision/recall per segment |
| Ignore rules / allowlists | Known expected failures repeat | Removing policy noise | Masking new regressions | Rule review cadence + sampled audits |
| Deduplication / grouping | High-volume repeats of same root cause | Reducing duplicate tickets and interruptions | Over-grouping distinct issues | Fingerprint collision review |
| Confirming-signal gates | Single signals are noisy or easy to spoof | Requiring stronger evidence | Slower detection for fast incidents | Time-to-detect and recall for P0/P1 |
| Human review queues | Low-confidence events still valuable to learn from | Keeping uncertain positives off pagers | Backlog growth | Queue SLA, sampling rate, label quality |
FAQ on false positives in AI detection and alerting
If you implement the measurement and triage framework above, the next practical step is to automate context capture and classification so engineers spend less time debating false positives and more time fixing real issues; Flash Log adds a decision layer that captures bugs even when users do not report them, classifies expected failures and duplicates, and routes only high-signal issues into the tools your team already watches.
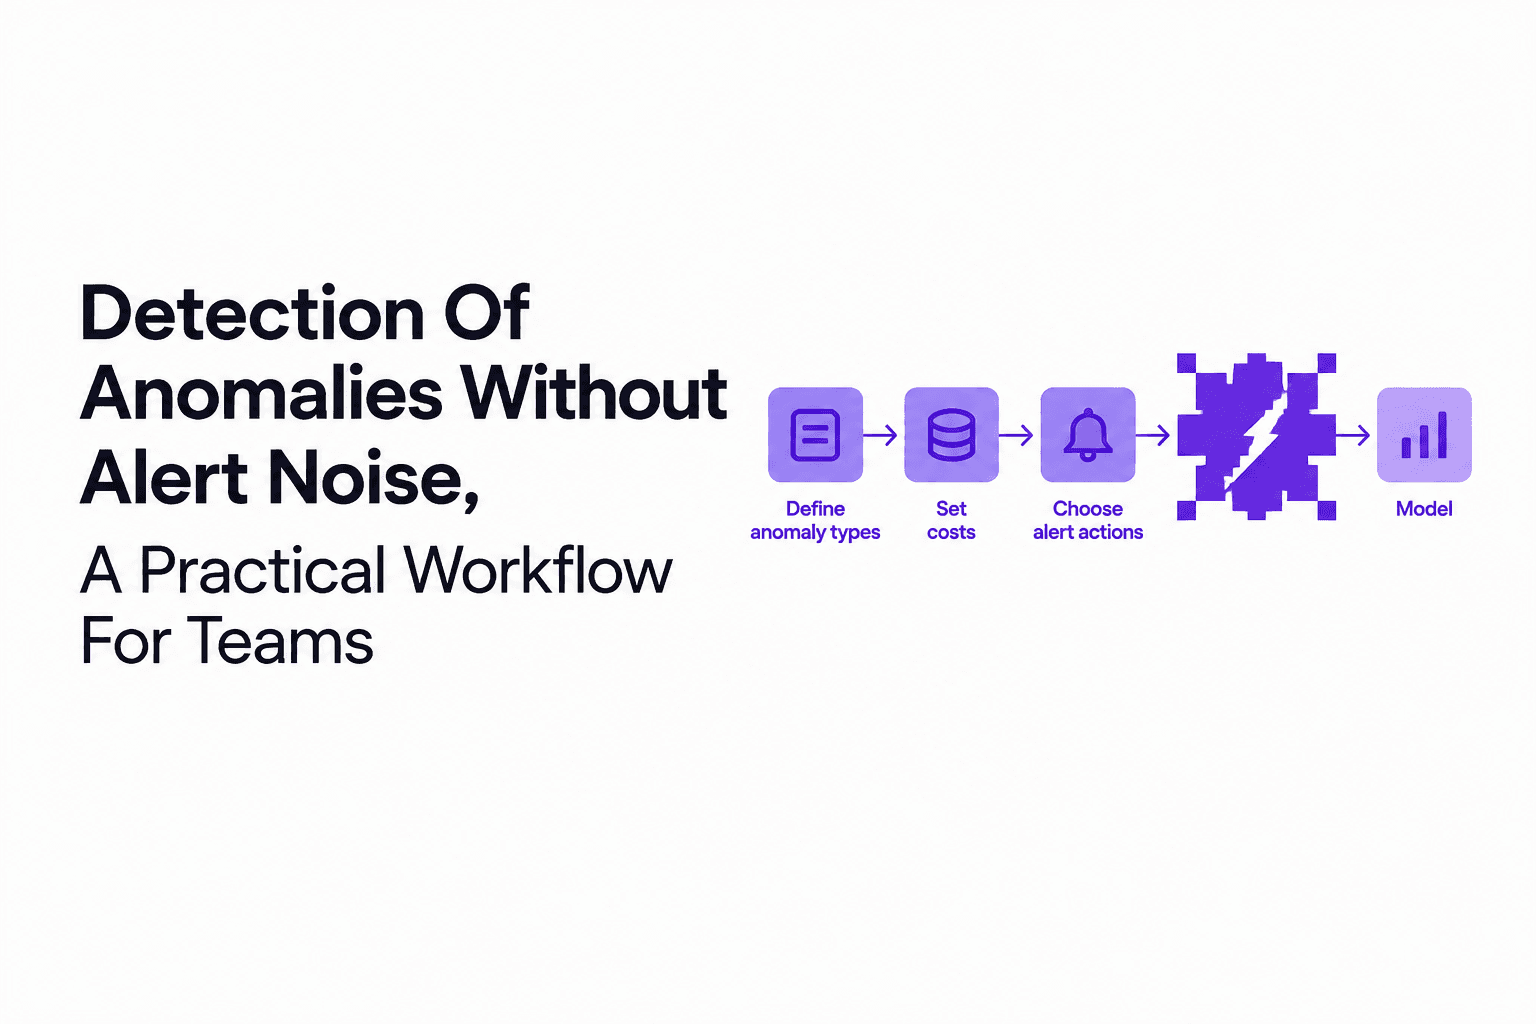
Detection Of Anomalies Without Alert Noise, A Practical Workflow For Teams
A practical workflow for detection of anomalies that reduces alert noise with cost-based thresholds, scarce-label validation, and ops-ready triage loops.

PagerDuty Alternatives Open Source, The 2026 Shortlist for Self-Hosted On-Call Paging
A practical 2026 shortlist of pagerduty alternatives open source, plus a decision tree and self-hosting checklist for reliable on-call paging.

Session Replay Tracking Explained, What It Shows and Why It Matters
Learn session replay tracking: what it captures, how playback works, and a starter checklist for debugging and UX insights without guesswork.