
Reduce Bug Reproduction Time With a Simple Workflow, Metrics, and Templates
Reduce bug reproduction time by standardizing what “repro-ready” means, measuring missing context, and using a repeatable triage workflow plus copy-paste templates that capture steps, environment, and technical evidence on the first pass.
- Track reproduction speed with a small set of operational metrics (time to reproduce, repro rate, missing-info rate) you can extract from Jira or Linear without new tooling.
- Use a decision-tree triage workflow that routes issues into cannot-repro, flaky, environment-specific, or data-dependent paths with clear next actions.
- Adopt templates that force the right context (steps, environment snapshot, failing request, attachments) so engineers can reproduce on the first attempt.
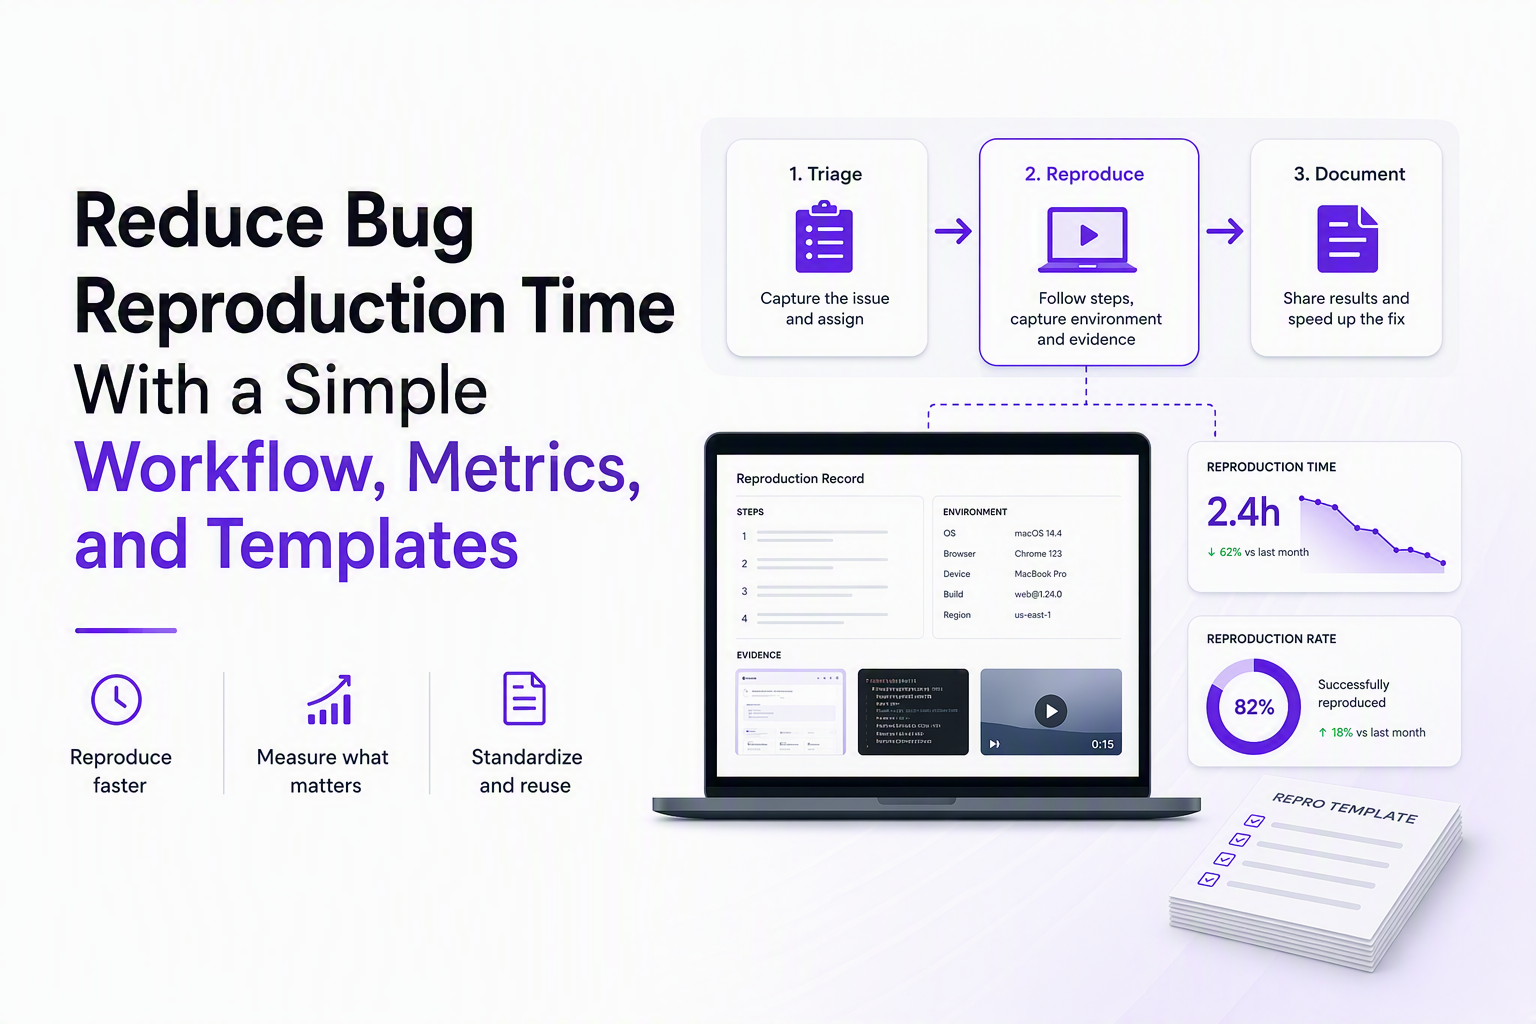
What bug reproduction time means in software and why it drives lead time
Bug reproduction time is the elapsed time from when an issue is first reported (or detected) to when an engineer can reliably reproduce it on demand in a known environment.
What “reproduce” actually means (a practical definition)
A bug is “reproduced” when someone can follow a documented set of actions and see the same failure again with a predictable trigger and observable outcome. “Observable” matters: you should be able to point to at least one artifact like an error message, a failing request, a screenshot, or a log line that confirms the repro happened.
Why reproduction time is a bottleneck (not just an engineering annoyance)
Long reproduction time stretches the entire fix cycle because everything upstream depends on a verified repro: correct prioritization, assigning the right owner, isolating scope, and validating the fix. In practice, teams don’t just lose engineering hours; they lose calendar time through back-and-forth across support, QA, and engineering, plus context switching when an issue comes back days later with more information.
How reproduction time differs from “time to resolve”
Time to resolve includes analysis, coding, code review, testing, and deployment. Bug reproduction time is the front slice. The reason it is so actionable is that you can reduce it with process and context capture even before you touch code.
Define and track the metrics that make reproduction faster
Teams that consistently reduce bug reproduction time treat it as an operational metric with a definition, a timestamped start and stop, and a “missing info” tag that can be counted.
Metric 1: Time to Reproduce (TTR) with a clear stop condition
TTR definition: the time from issue creation to the moment an engineer marks the issue as “Reproduced” (or equivalent) with a link to evidence.
- Start timestamp: issue created (by user report, support, QA, monitoring, or automated detection).
- Stop timestamp: a dedicated status or label like Reproduced plus an evidence field populated (for example: failing request ID, video/screenshot link, stack trace, or session ID).
In our experience, the single biggest improvement comes from making “Reproduced” a real workflow state rather than an implied comment like “I can repro.” That change alone makes your data queryable and stops silent partial repros.
Metric 2: Repro rate (first-attempt)
Repro rate definition: percentage of issues reproduced without asking for additional information after the first handoff to engineering.
- Numerator: issues that reach “Reproduced” with no “Need more info” transition.
- Denominator: all issues sent to engineering for investigation.
This is a quality metric for incoming reports. A low repro rate usually means your reports lack one of the three essentials: steps, environment, or technical evidence.
Metric 3: Missing-info rate (and the top missing fields)
Missing-info rate definition: the percentage of incoming issues that get a “Need more info” tag or status change at least once.
Also track which info was missing. Keep it simple by using a multi-select custom field or labels such as:
- missing_steps
- missing_env
- missing_expected_actual
- missing_network
- missing_logs
- missing_permissions_data (roles, account state, feature flags)
How to instrument these in Jira or Linear (minimal setup)
- Add a status: “Reproduced” between “Triaged” and “In Progress.”
- Add a single required field on Reproduced: “Repro evidence link” (URL field) or “Evidence” (text) with examples in the description.
- Add a status: “Need more info” (or a label) and require a “Missing info type” selection when used.
Once those exist, you can compute TTR from issue history, repro rate from transitions, and missing-info rate from labels without any new analytics tool.
A repeatable playbook to reduce bug reproduction time from triage to verified repro
A fast reproduction workflow is a decision tree that routes each issue into the smallest next action that produces evidence, not into a long open-ended investigation.
Step 1: Triage in 5 minutes using a repro-ready checklist
Before an issue goes to engineering, confirm it has these minimum fields:
- Trigger: the user action that precedes the failure (click, navigation, API call, background job).
- Expected vs actual: one sentence each.
- Environment snapshot: app version or release, browser or device (if relevant), and whether it’s production or staging.
- Evidence: at least one artifact (screenshot, error text, failing request, console snippet, log line, or replay link).
If any are missing, route to “Need more info” immediately. Waiting until an engineer picks it up is how you accumulate multi-day delays.
Step 2: Choose the correct branch (cannot-repro, flaky, env-specific, data-dependent)
Use one of these four branches so the next step is obvious:
- Cannot reproduce: no one can repro with the provided steps.
- Flaky: reproduces intermittently with the same steps.
- Environment-specific: only happens on a particular browser, device, OS, or release.
- Data-dependent: requires a specific account state, permissions, feature flag, or dataset.
Branch A: Cannot-repro workflow (what to ask for, in order)
- Confirm the observable: what exactly should you see when it fails (error text, status code, UI state).
- Pin the environment: app release, browser or device, and whether it was incognito, extension-enabled, or behind a corporate proxy.
- Request the smallest technical artifact: failing request details (endpoint and status) or a screenshot with timestamp.
When we audited our own issue intake, the pattern was clear: most “cannot repro” tickets were really “cannot verify” because the expected observable was never written down.
Branch B: Flaky workflow (turn randomness into a trigger)
- Define a reproduction window: “1 out of N attempts” and capture N (for example, “fails about 1 in 10 submits”).
- Capture timing signals: request duration, client time, and whether retries happened.
- Tag it as flaky and gate the goal: the goal is to isolate a condition (latency spike, race, cache state), not to get a perfect deterministic repro immediately.
Branch C: Environment-specific workflow (reduce the matrix)
- Start with a single axis: browser family (Chrome, Safari, Firefox) or device class (mobile vs desktop).
- Freeze the release: confirm the exact app version or commit SHA if available.
- Collect one “known good” comparison: same steps in an environment where it does not happen.
Branch D: Data-dependent workflow (make the state reproducible)
- Identify the state: role, subscription plan, permissions, feature flags, and whether the account is newly created or long-lived.
- Create a test fixture: a seeded account or dataset that engineering can access.
- Record identifiers safely: order ID, user ID, tenant ID, or correlation ID (avoid copying sensitive content).
Step 3: Produce a repro package (what engineering needs in one place)
A “repro package” is a single issue description that includes reproduction steps, environment, and evidence so an engineer can attempt the repro without a meeting or a follow-up thread.
If you want an additional lever to reduce bug reproduction time, capture user journey evidence. Tools in the web session replay category can help reconstruct what happened when the report is vague, especially when combined with the failing request and environment metadata.
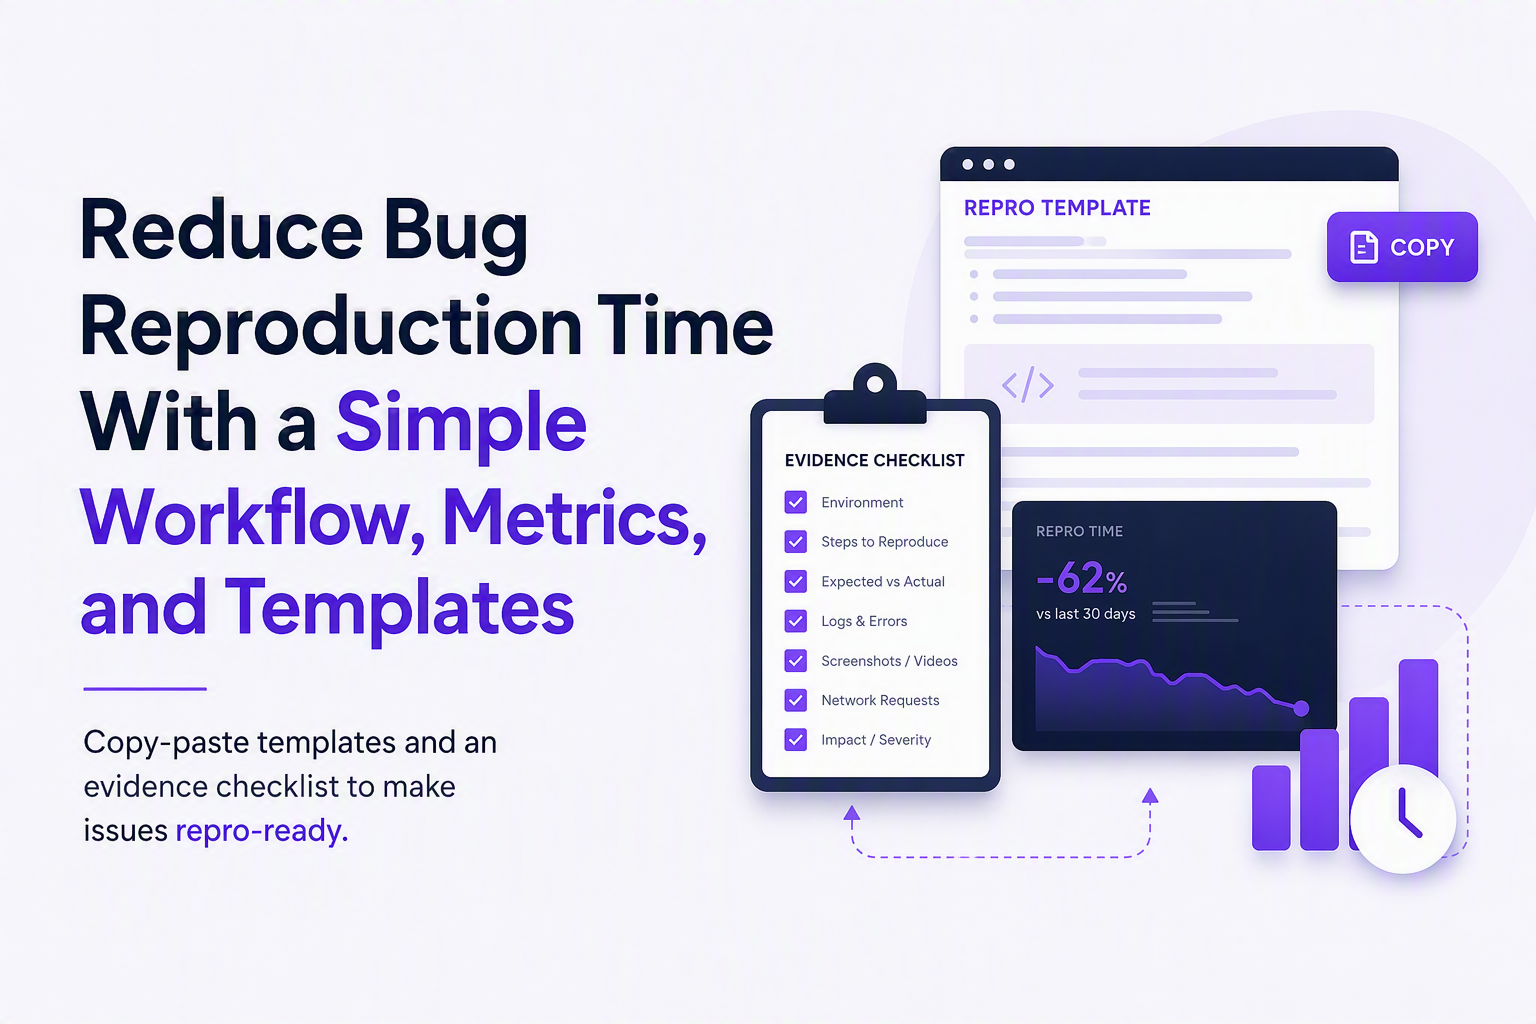
Copy-paste templates that cut back-and-forth and speed reproduction
Templates reduce bug reproduction time by forcing the minimum viable context into every report, which prevents the most common “can you share…” follow-ups.
Template 1: Repro-ready bug report (paste into Jira or Linear)
Title:
[Area] [Action] [Failure] (e.g., Checkout Confirm Order returns 500)

Summary:
One-sentence description of the problem and user impact.

Expected:
What should happen.

Actual:
What happened instead (include exact error text if visible).

Reproduction steps:
1)
2)
3)

Environment:
- App release/version:
- URL/page:
- Browser + version (or device + OS):
- Network (wifi/cellular/VPN/proxy if relevant):
- Account/role/plan:

Evidence (link at least one):
- Screenshot/video:
- Console error:
- Failing request (endpoint, status, timing):
- Logs/correlation ID:

Notes:
Anything that makes it more/less likely (frequency, timing, recent changes).
Template 2: Minimal reproduction steps (when the report is messy)
Minimal steps (confirmed):
1) Start from [URL/state]
2) Use [test account / role]
3) Perform [single key action]
4) Observe [specific failure signal]

Not required to reproduce:
- [step you removed]
- [step you removed]
Template 3: Environment snapshot checklist (fast, consistent)
- Release: web@x.y.z or build number
- Runtime: browser and version, OS and version, device model
- Viewport: desktop vs mobile size if UI-related
- Network: normal, VPN, proxy, throttled, offline/online transitions
- Account state: role, plan, feature flags, tenant
Template 4: Attachment checklist (choose the smallest useful artifact)
- Network evidence: endpoint, status code, timing, request ID (or HAR when needed)
- Frontend evidence: console error text and stack trace snippet
- Backend evidence: correlation ID, log link, or error signature
- User journey evidence: screen recording or session view
In our experience working with product and support teams, the fastest wins come from standardizing the “smallest useful artifact” per category so people stop defaulting to long videos when a request ID would have been enough.
| Issue type | Most efficient evidence to request first | Why it helps reproduction |
|---|---|---|
| API or form submit fails | Failing endpoint + status + request ID (or timing) | Lets engineers match the failure to server logs and recreate the request shape |
| UI renders wrong / layout bug | Screenshot + viewport size + browser | Most UI bugs are environment and CSS dependent |
| Crash or exception | Console error + stack trace snippet | Pinpoints the failing code path quickly |
| Intermittent slowdown | Timing (TTFB, request duration) + network conditions | Separates backend latency from client performance |
| Permissions / role issue | Account role + tenant + exact denied action | Makes the required data state reproducible |
FAQ
If you’ve implemented the workflow and templates above and still struggle to reduce bug reproduction time because reports arrive without context, you can evaluate automated capture tools like Flash Log, which uses AI to automatically capture and classify bugs and attach user-journey, failing-request, and environment context even when users do not explicitly report the issue.

Alert Management That Engineers Actually Trust - A Noise-Reduction Blueprint With Templates
A practical alert management blueprint: ingest, normalize, dedupe, suppress, route, and measure alerts with copy-paste templates and KPIs.
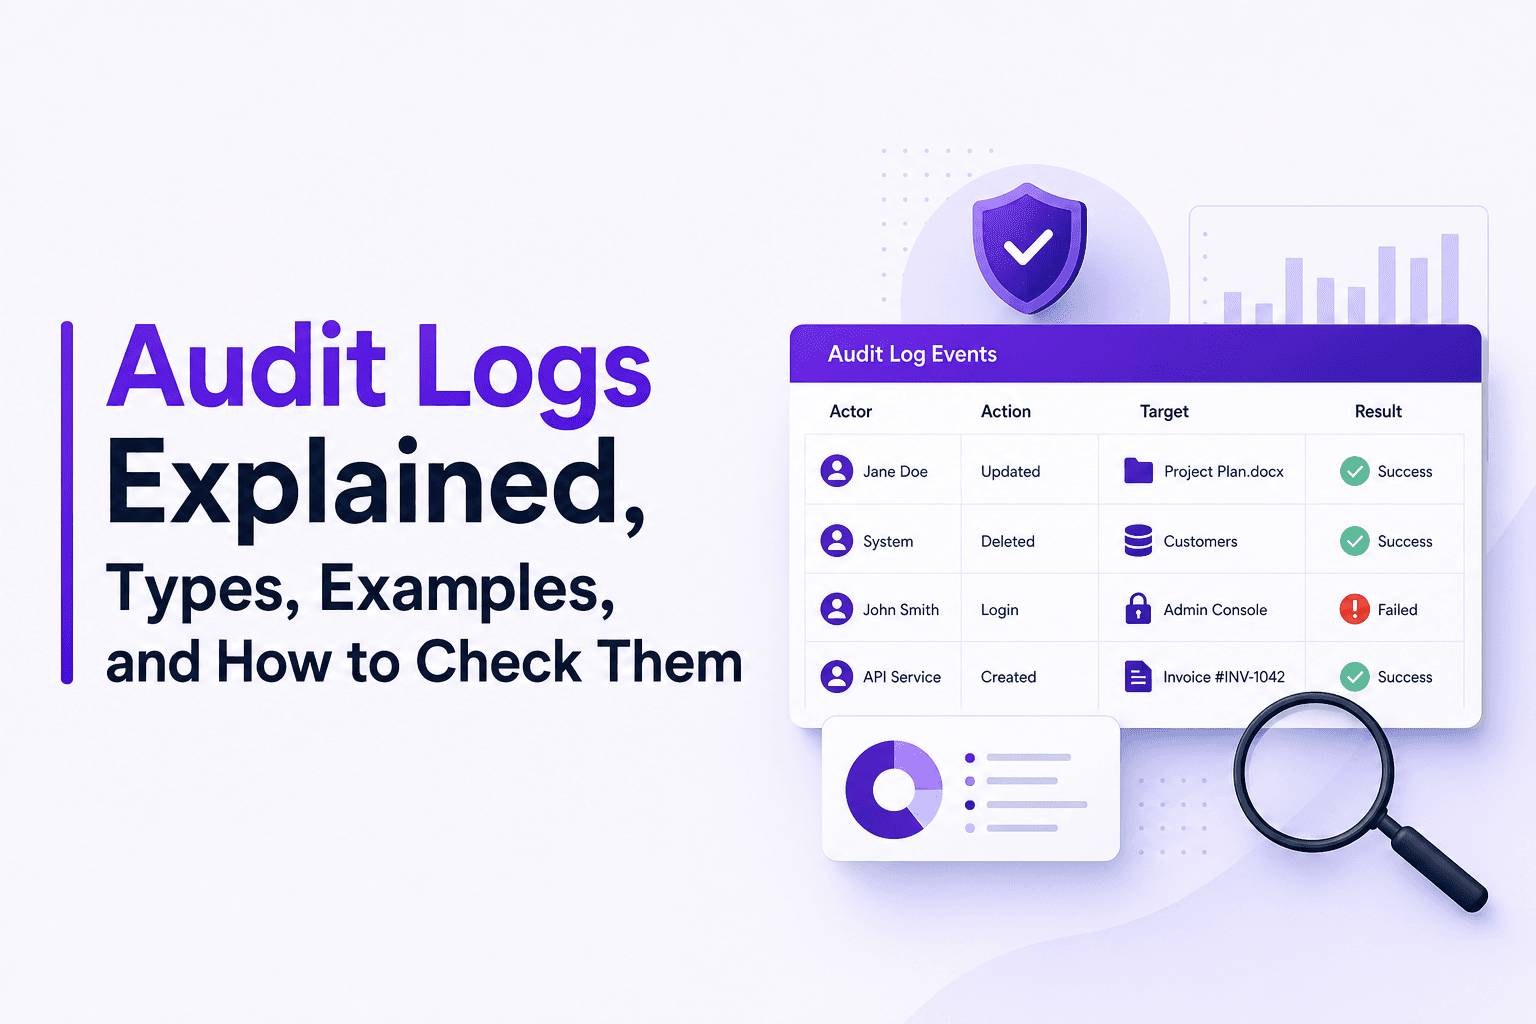
Audit Logs Explained, Types, Examples, and How to Check Them
Learn what audit logs are, the two key types, minimum fields, copyable examples, and how to check audit logs in Microsoft 365, Azure, Power BI, and Linux.
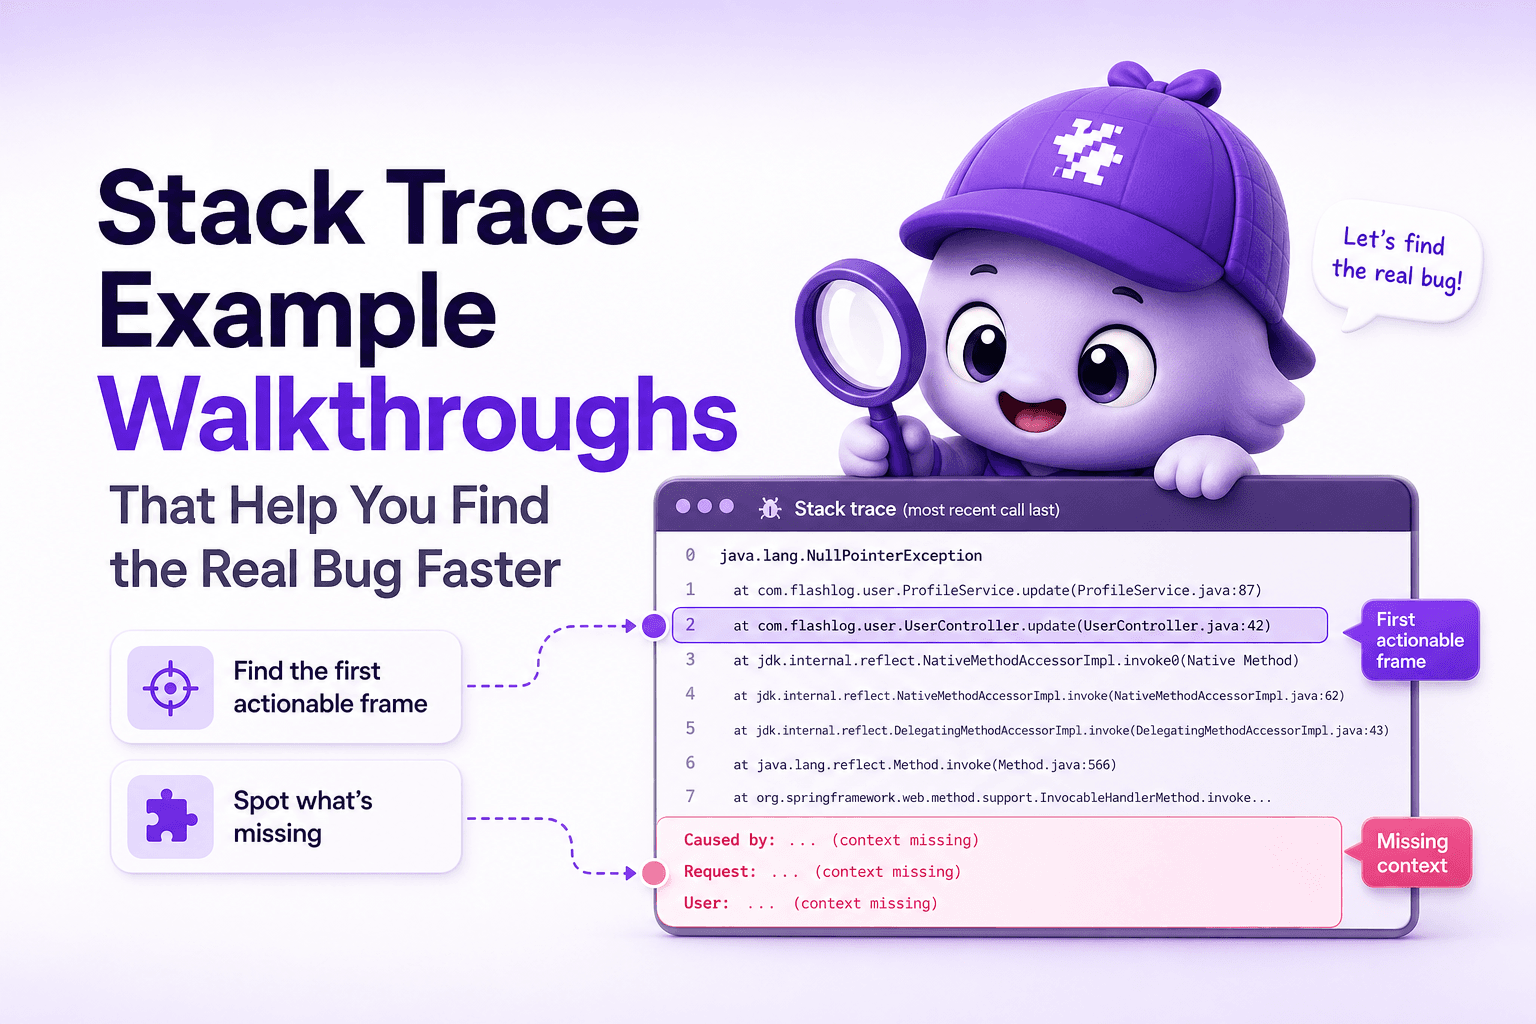
Stack Trace Example Walkthroughs That Help You Find the Real Bug Faster
Learn how to read a stack trace example in production, spot the first actionable frame, and gather the missing context to fix bugs faster.