
Web Session Replay Explained With a Step-by-Step Setup and One Real Debugging Example
Web session replay records a real user’s in-browser journey so you can watch what happened, correlate it with errors and network activity, and debug issues that traditional analytics can’t explain.
- Use web session replay when you need qualitative context (what the user did) to explain a quantitative symptom (drop-off, rage clicks, support tickets).
- Most replay tools work by capturing an event stream (clicks, inputs, DOM mutations) and reconstructing the page state; fidelity and privacy depend on configuration.
- A first-time setup should include verification steps (events, SPA navigation, masking) and a repeatable triage workflow that ties replay timelines to console errors and failing requests.
What Web Session Replay Is and When It Beats Traditional Analytics
Web session replay is most valuable when you need to see the sequence of user actions that led to a bug or conversion problem, not just counts and percentages.
Session replay vs analytics in one sentence
- Traditional analytics answers “how many” and “where” (drop-off rate, funnels, cohorts).
- Session replay answers “how exactly” (what the user clicked, what changed on screen, what failed).
Use-case triggers that justify turning on replay
Use this quick decision checklist to decide when web session replay beats dashboards alone:
- High-impact mystery: a key flow breaks (checkout, onboarding, login) but metrics do not show why.
- Intermittent bugs: issues reproduce only in production, on certain devices, or under specific network conditions.
- “It doesn’t work” support tickets: users can’t describe steps precisely, or they abandon before reporting.
- UX friction signals: rage clicks, repeated form submissions, fast back-and-forth navigation.
What replay is not good for
- Long-term trend measurement: use analytics for month-over-month performance and attribution.
- Answering “why” at scale: replays help you form hypotheses; you still validate with experiments, logs, or analytics.
How Web Session Replay Works Under the Hood
Web session replay typically reconstructs a session by recording an initial page state plus a time-ordered stream of browser events and DOM changes.
The core data streams most tools capture
- DOM snapshot + mutations: a baseline snapshot, then incremental changes as the UI updates.
- User input events: clicks, taps, scroll, keypresses, focus/blur, and sometimes pointer movement (often sampled).
- Navigation history: URL changes, referrers, and route changes for SPAs.
- Console signals: JavaScript errors and warnings, sometimes with stack traces.
- Network metadata: request URL, method, status, and timing; some setups also capture headers and payload metadata with masking rules.
Replay fidelity tradeoffs you should decide up front
Replay fidelity is a set of deliberate compromises between accuracy, performance overhead, and privacy.
- Input recording: recording text inputs helps reproduction, but should be masked by default for sensitive fields. If you want a deep dive, see sensitive data handling patterns.
- Network capture depth: capturing full bodies is rarely necessary for first-time adopters; status, endpoint, and timing usually find the bug faster with less risk.
- Sampling: start with targeted sampling (specific pages, environments, or error-triggered capture) before recording everything.
In our experience working with teams adopting replay for the first time, most “replay didn’t help” complaints come from missing context like route changes in an SPA or a lack of network timing, not from the absence of more pixels.
Privacy and consent are part of the technical design
Before rolling out broadly, decide your capture boundaries: what to mask, what to exclude, and how to respect consent signals. A practical starting point is to define a policy for (1) authenticated pages, (2) payment pages, and (3) any field types you always redact, then implement consent gates using a consent management framework.
For a deeper explanation of the mechanics and what gets captured, the guide on session replay technology is a useful reference.
How to Record a Web Session Step by Step From Install to First Useful Replay
A reliable first web session replay setup follows a predictable flow: install, verify capture, verify navigation, verify masking, then create a repeatable triage filter.
Step 1: Install and confirm you can see any session
- Add the replay snippet/SDK in your web app entry point.
- Open the site in an incognito window and perform a short flow (3 to 5 actions).
- Confirm the session appears in the tool with: URL, device/browser, and session duration.
Step 2: Verify the three minimum signals for debugging
Before inviting the team, ensure replays include these “minimum viable debugging signals”:
- Timeline of actions: click, input, submit, navigation events appear in order.
- Error visibility: at least JavaScript exceptions or console errors show up near the right timestamp.
- Network outcome: failing requests show status codes and endpoints, even if bodies are not captured.
Step 3: SPA and route-change checklist
Single-page apps often “look fine” in replay until you realize route changes were not recorded correctly. Run this checklist on a React/Vue/Angular app:
- Navigate across 3 internal routes and confirm the replay shows URL changes and page transitions.
- Trigger a lazy-loaded route and confirm the DOM updates in the replay match what you saw live.
- Test a modal or drawer flow; confirm the replay captures open/close and form interactions.
Step 4: Masking and redaction verification
Do a deliberate masking test session and then watch the replay as if you were a developer receiving a bug report:
- Type into a password field, token field, and a free-text field; confirm the sensitive ones are masked/redacted.
- Confirm “copy/paste” does not reveal hidden values in the replay.
- Confirm query parameters that contain secrets are excluded or scrubbed.
Step 5: Create your first triage filter
To avoid “too many videos,” define a filter you can use daily:
- Scope: start with one critical flow (for example, checkout or signup).
- Trigger: filter sessions with errors or failed requests (4xx/5xx) on that flow.
- Segment: split by browser, device class, and release/version if available.
We initially assumed sampling had to be aggressive on day one, but after running a small pilot on just the checkout and signup routes, the pattern was clear: targeted filters reduce noise more than lowering capture rates.
A Web Session Replay Example Walkthrough From Rage Click to Root Cause
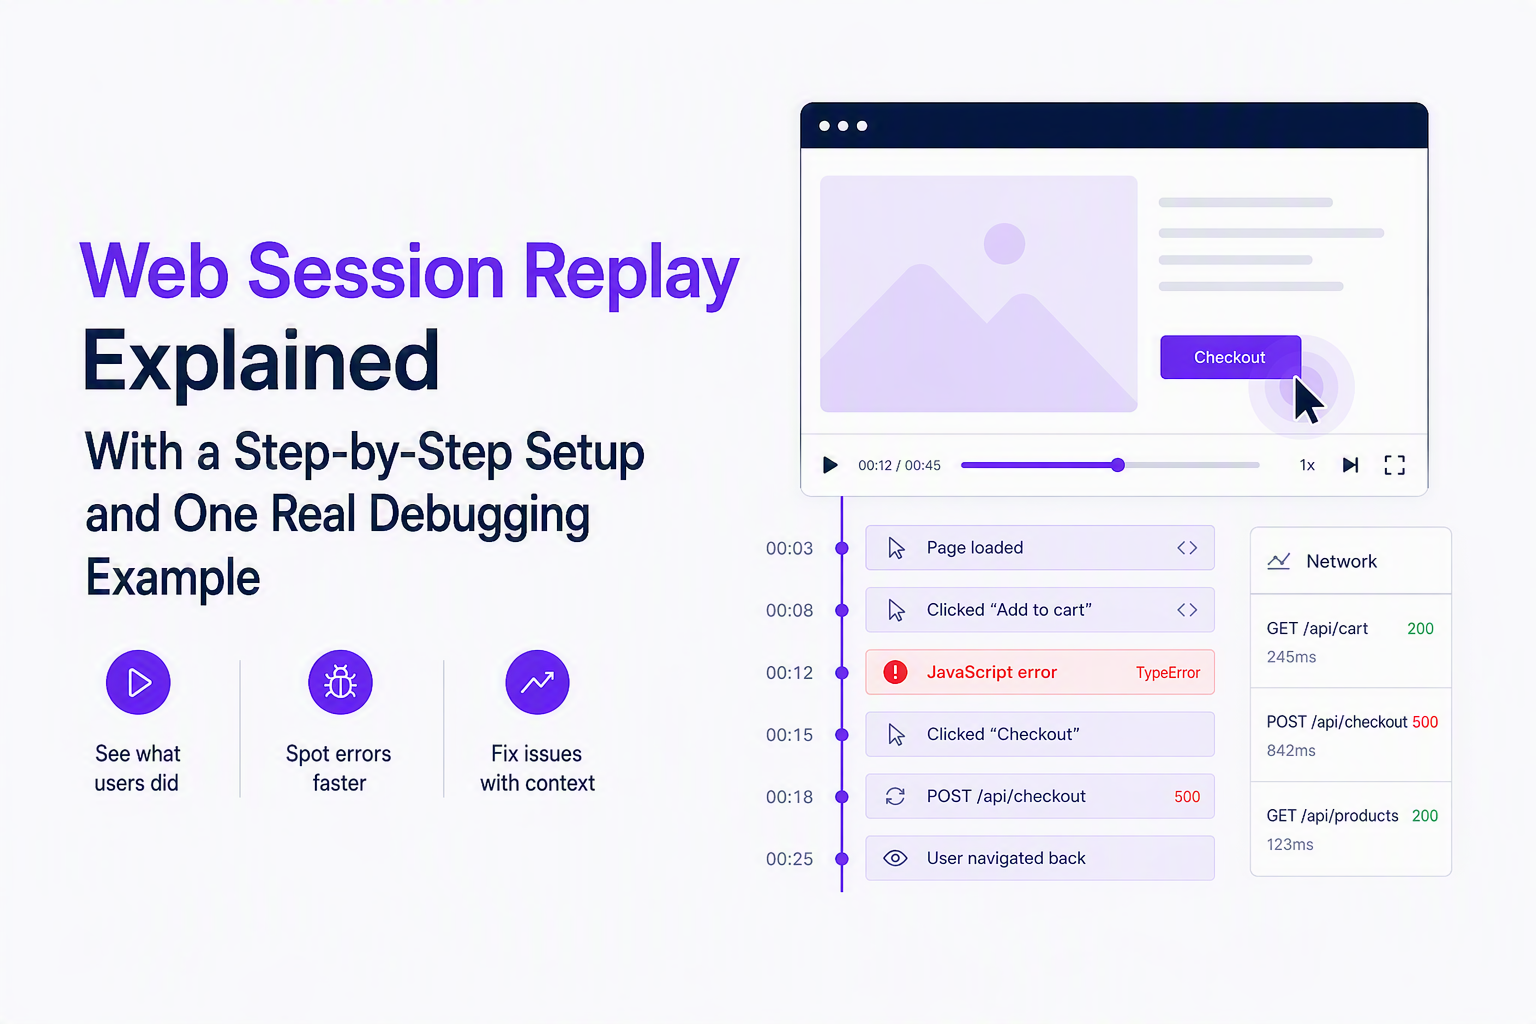
A practical way to interpret a web session replay is to read it like a timeline of hypotheses: user intent, UI feedback, error signal, and the request that proves the failure.
The scenario
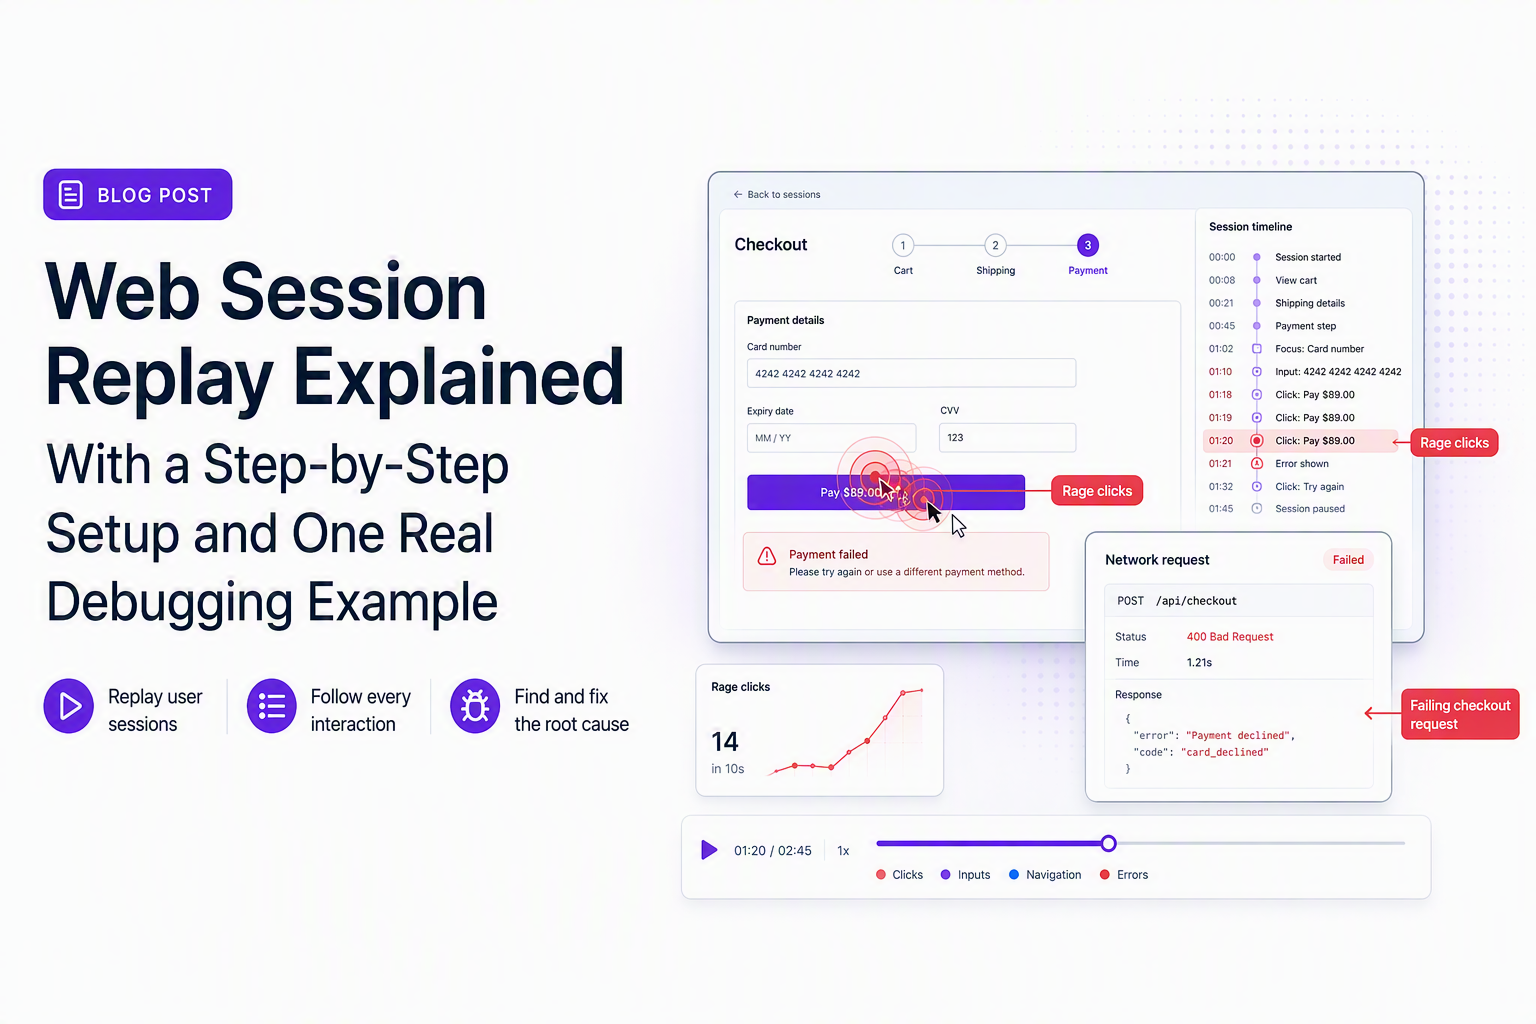
Symptom: users rage-click “Confirm order” on mobile, then abandon. Analytics shows a checkout drop-off spike, but no clear reason.
How to analyze the replay in 6 passes (same order every time)
- Confirm the user goal: watch the 10 to 20 seconds before the event. Did they fill the form, select shipping, apply a code?
- Mark the first “weird” UI signal: repeated clicks, disabled button, spinner stuck, toast flashes.
- Pin the exact timestamp: note when the first rage click happens, then keep that time as your anchor.
- Check console errors near the anchor: look for an exception that starts at that time (for example, “TypeError reading property of undefined”).
- Check network outcomes near the anchor: locate the request triggered by the click and verify status and latency.
- Validate environment constraints: confirm browser/OS, viewport, and release to see if the issue matches a specific deployment.
What the timeline reveals (annotated)
- 00:41 User taps “Confirm order” three times within two seconds (rage click signal).
- 00:41 A request fires:
POST /api/checkout. - 00:42 The response returns
500after ~800 ms; UI spinner stays on screen. - 00:42 Console logs show an unhandled error in the error-handling path, so the UI never shows a failure state.
Turning replay into a repro you can hand to engineering
Write the bug report in a format that pairs action steps with the technical proof from the replay:
- Steps: Mobile viewport, add item, open checkout, fill required fields, tap Confirm order.
- Expected: order confirmation page.
- Actual: spinner persists; repeated taps; no error message.
- Evidence: failing request
POST /api/checkoutreturns500; console error indicates UI error state not rendered.
Once you can identify the failing request and timestamp, standard debugging takes over: correlate the endpoint and approximate time with server logs, traces, or deployment changes. If you want more structure for this handoff, see website session replay workflows for bug triage.
| Goal | Best first tool | Why | What to record/capture |
|---|---|---|---|
| Find where users drop off | Analytics funnel | Quantifies scale and segments | Events, conversions, cohorts |
| Understand why a drop-off happens | Web session replay | Shows the exact interaction sequence | Clicks, inputs (masked), route changes |
| Prove a backend failure caused a UX issue | Replay + network metadata | Connects action to request, status, timing | Endpoint, status, latency, correlation IDs if available |
| Fix environment-specific bugs | Replay + environment context | Browser/OS/viewport narrow root cause | Browser, OS, device class, release |
FAQ
If your team wants the benefits of web session replay but keeps missing bugs because users never report them, Flash Log is an optional next step: it automatically captures and classifies bugs with session-like reproduction context so engineers can see the user journey, failing request, and environment without extra back-and-forth.
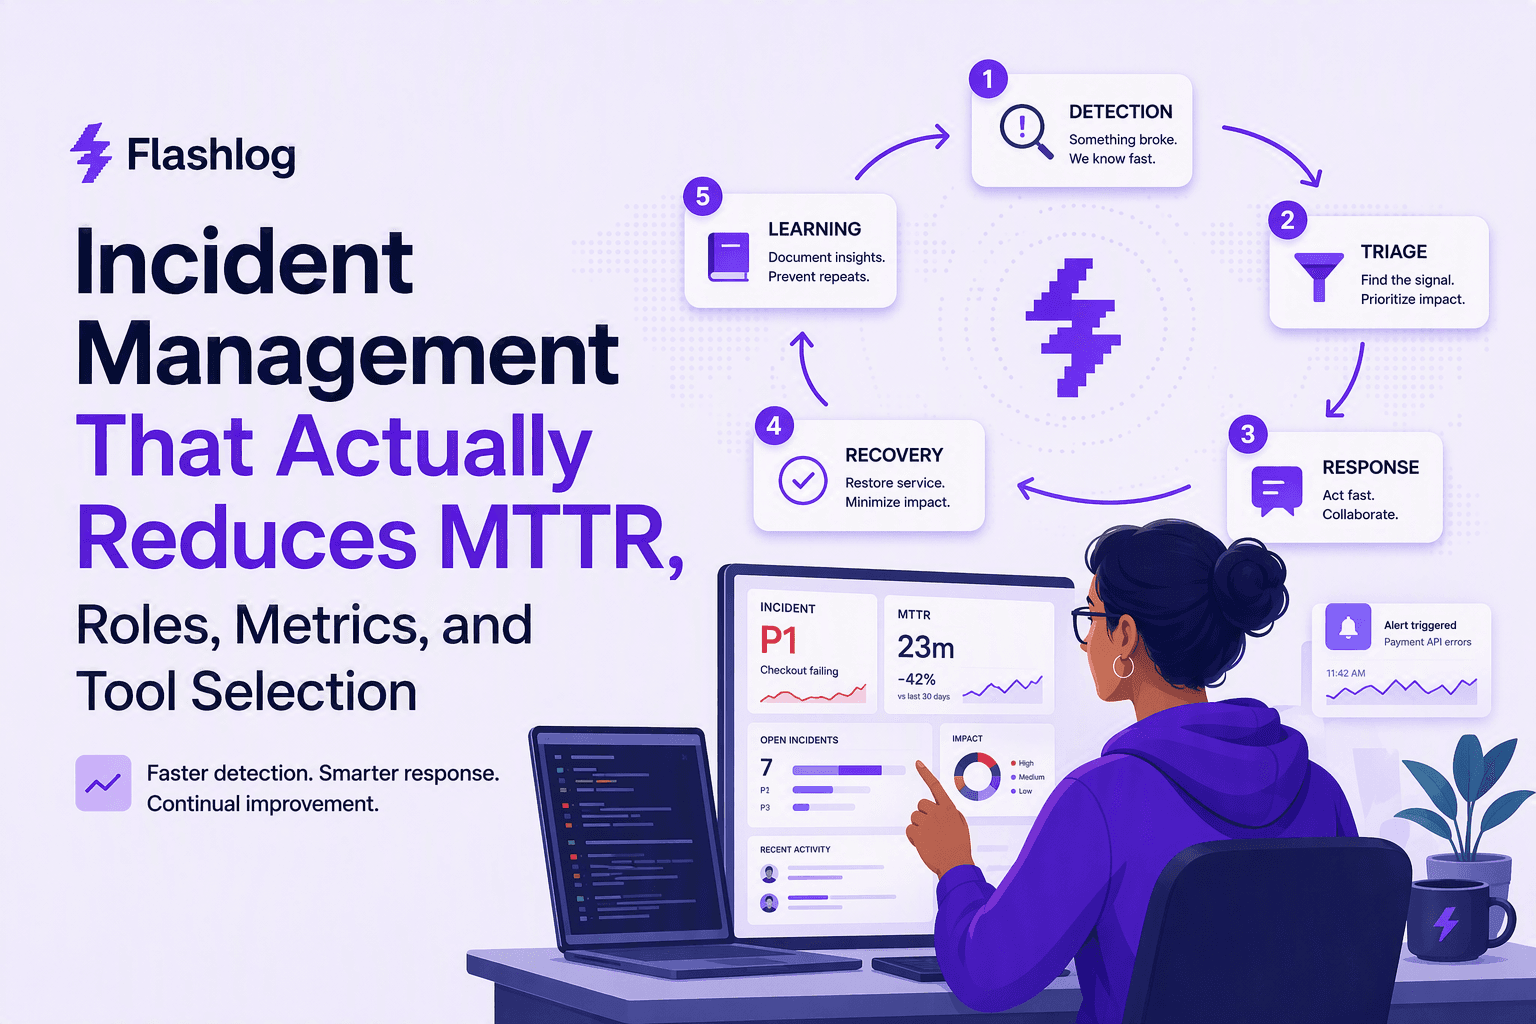
Incident Management That Actually Reduces MTTR, Roles, Metrics, and Tool Selection
A practical incident management playbook: 5-step loop, RACI ownership, MTTR metrics, and tool selection criteria for on-call, ITSM, and AIOps.
Issue Tracking Software for Support Teams, A Decision Framework and Workflow Blueprint
Choose issue tracking software for support-led bug intake using a decision matrix, workflow blueprint, and proactive detection layer for faster triage.
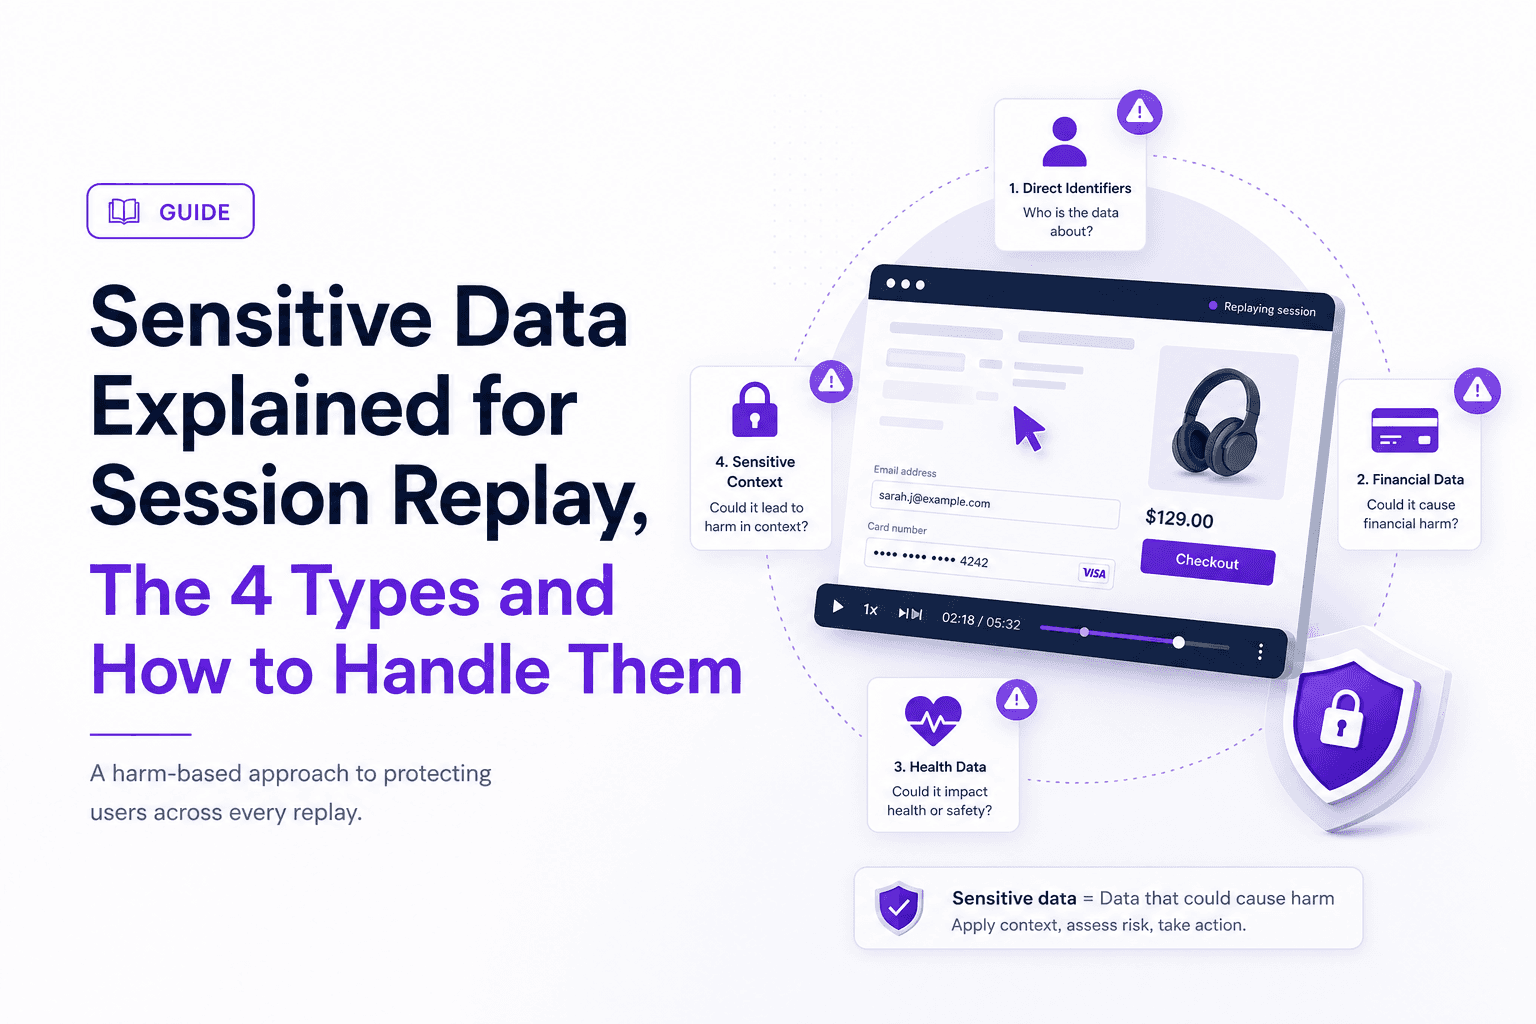
Sensitive Data Explained for Session Replay, The 4 Types and How to Handle Them
Learn what sensitive data means for session replay, a 4-type taxonomy, and a discover → classify → mask → retain workflow to reduce privacy risk.