
Detection Of Anomalies Without Alert Noise, A Practical Workflow For Teams
Detection of anomalies works in production only when every alert is tied to a defined cost, a clear action, and a validation loop that keeps noise from creeping back in.
- Define anomalies by “what action changes” and score mistakes with a simple cost matrix before you pick a model.
- Choose method families (statistical, ML, deep learning) based on data shape, drift, and latency, then tune thresholds against alert fatigue metrics.
- Reduce noise upstream with dedupe, grouping, and seasonality handling so you do less modeling and get more trustworthy alerts.
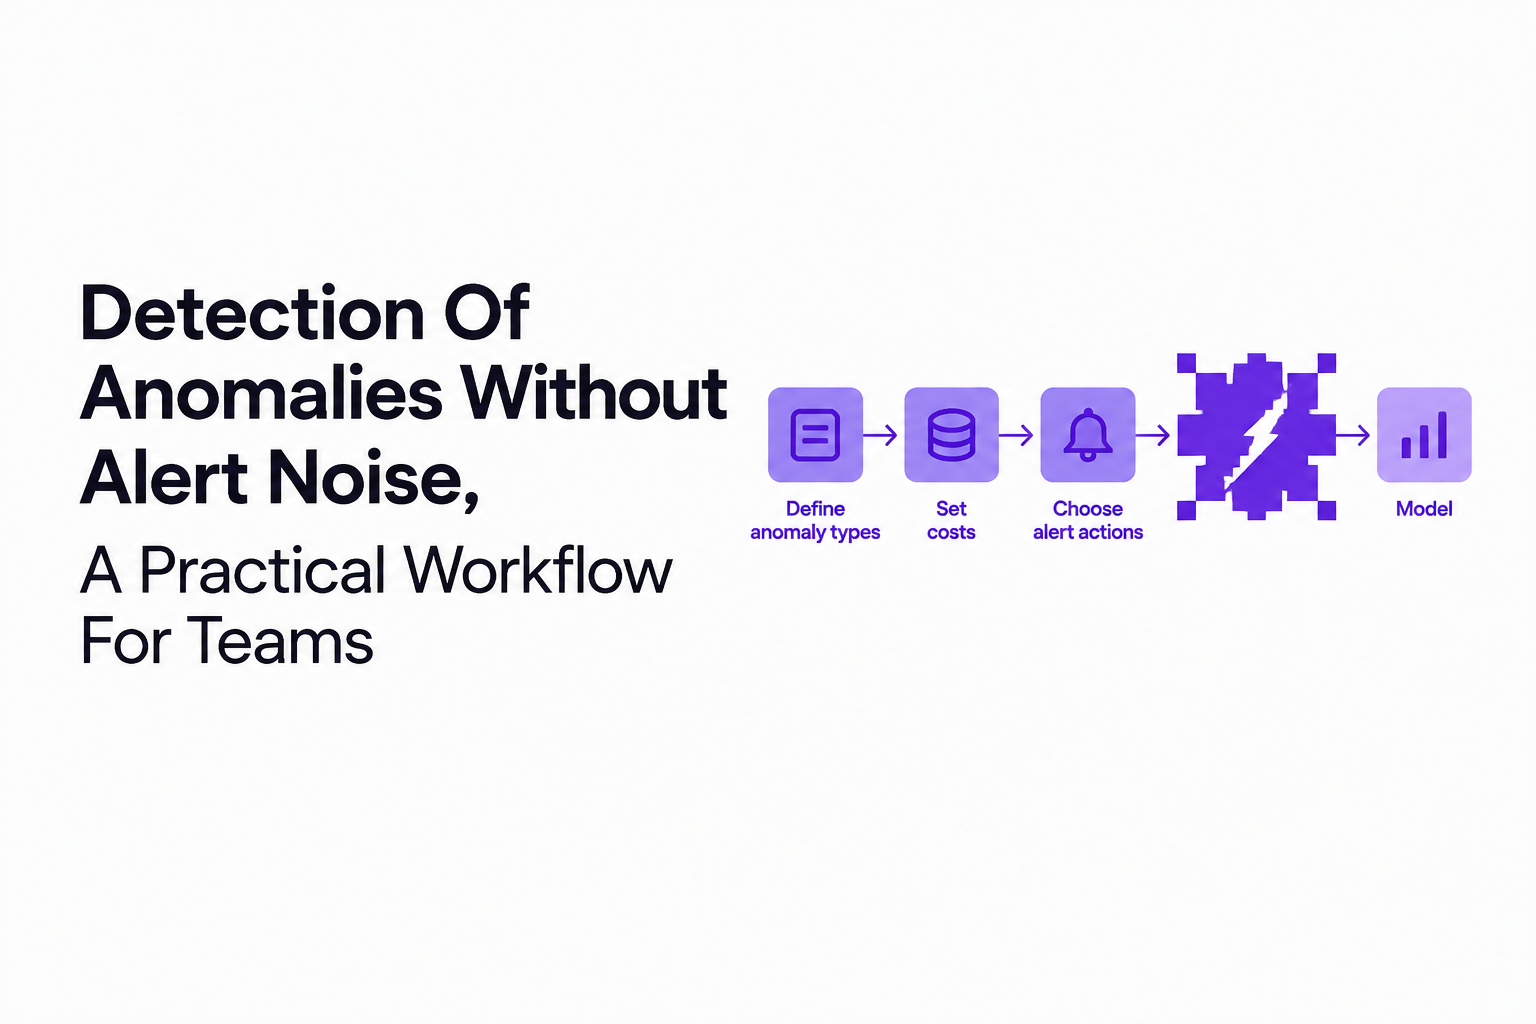
Detection Of Anomalies In Practice Means Defining Normal, Costs, And Alert Actions
Detection of anomalies becomes reliable when “anomalous” is defined as a deviation that triggers a specific operational action with an explicit cost of being wrong.
Step 1: Classify the anomaly type by how it fails
Before algorithms, classify the anomaly by its failure mode because each one implies different features and thresholds:
- Point anomalies: a single spike or drop (e.g., error rate jumps from baseline to a sharp peak).
- Contextual anomalies: only anomalous given context (e.g., 200ms latency is normal at 2pm but not at 2am if batch jobs are off).
- Collective anomalies: a pattern over time is wrong (e.g., a slow burn memory leak that shifts p95 over 3 hours).
- Novel class anomalies in discrete events (e.g., a new error signature appears in logs after a deploy).
Step 2: Write “normal” as an operational contract, not a distribution
For engineering teams, “normal” should be documented as constraints plus allowed variability. A lightweight template we use:
- Entity: what is monitored (endpoint, service, customer segment, queue, payment provider).
- Metric/event: what signal is measured (5xx rate, checkout completion, Kafka lag, exception fingerprint).
- Seasonality: daily/weekly cycles that are expected (weekday peaks, cron windows).
- Known expected failures: declines, rate limits, validation errors that do not require engineering action.
- Action: what happens when alert fires (page on-call, create ticket, annotate dashboard, or suppress).
Step 3: Build a cost matrix that forces threshold discipline
Thresholding is impossible to justify without a cost model. Use a simple 2x2 that you can agree on in a 15 minute review:
| Outcome | What happens | Cost to assign | Example |
|---|---|---|---|
| True positive | Real incident caught early | Benefit (avoid revenue loss, MTTR reduction) | Checkout 500s detected within minutes |
| False positive | Alert noise, context switching | On-call time + trust erosion | Payment declined events waking on-call |
| False negative | Missed anomaly | Customer impact + delayed fix | Slow memory leak not alerted until OOM |
| True negative | No action needed | 0 | Optional CDN image 404 ignored |
In our experience, writing down even rough relative costs (for example, “one false page equals 30 minutes of engineer time”) changes how people argue about thresholds: you stop optimizing “accuracy” and start optimizing “total operational cost.”
Step 4: Define alert meaning with one sentence and one runbook link
Every alert should pass the “lift test”: an on-call engineer should be able to read the alert title and know the first action. Good format:
- Alert sentence: “Checkout submit 5xx rate is above expected for this hour; investigate recent deploy and dependency health.”
- First action: “Compare error fingerprint counts by release version; check payment gateway latency; roll back if correlated.”
A Decision Framework To Choose The Right Anomaly Detection Method Without Adding Noise
Choosing the method family for detection of anomalies should be driven by data type, drift, label availability, and required latency, not by model sophistication.
A 4-question decision tree you can apply in one meeting
- Is the signal univariate time series (single metric) or multivariate/event-based?
- Do you have labels or at least incident timestamps that you trust?
- How strong is seasonality and drift? (deploys, growth, pricing changes)
- What latency is required? (seconds for security or payments; minutes for performance; hours for capacity)
Method family selection table
| Scenario | Best starting family | Why it’s low-noise | Common failure mode |
|---|---|---|---|
| Single metric with seasonality (p95 latency, RPS) | Robust statistics + seasonal baseline (median/MAD, STL) | Interpretable, cheap, easier thresholding | Breaks during regime shifts if baseline not adaptive |
| Multiple correlated metrics (CPU, mem, queue lag) | Multivariate methods (PCA-based, isolation methods) | Uses correlation to reduce spurious spikes | Harder to explain and to route to owners |
| Discrete events/logs with repeats | Counting + grouping + simple models | Deduping reduces alert volume before scoring | Alert storms if duplicates are not grouped |
| Rich sequences (user journeys, traces) with little labels | Representation learning cautiously | Can capture complex context if validated | High false positives without strong evaluation loop |
Practical criteria that prevent “modeling your way into noise”
- Prefer robust baselines first: If a simple seasonal baseline catches most real issues, keep it and invest in noise controls.
- Use model complexity only to fix a specific miss: add multivariate context because univariate rules page on harmless traffic shifts; add sequence models because error signatures depend on user path.
- Demand explainability proportional to blast radius: paging alerts need clearer reasons than weekly review alerts.
- Pick features that map to ownership: an alert should point to a team or component, not just “anomaly score high.”
We initially assumed a more complex detector would reduce pages, but the pattern after several iterations was clear: reducing duplicates and expected failures upstream removed more noise than swapping algorithms.
The Missing Piece In Most Guides Is Thresholding And Validation With Scarce Ground Truth
Thresholds for detection of anomalies should be set against expected alert volume and the cost matrix, then validated by backtesting and lightweight labeling rather than single-metric accuracy.
Three thresholding strategies that work under real constraints
- Quantile thresholds: Choose a percentile of historical scores (for example, alert only on the top 0.1% most unusual points per entity). This directly controls expected volume, but needs stable history.
- Dynamic baselines: Maintain an adaptive expected value for each seasonality bucket (hour-of-week is a common practical bucket), then alert on deviation relative to robust spread (MAD or IQR). This reduces false positives when traffic cycles.
- Extreme Value Theory (EVT): Fit a tail model to high scores and pick a threshold by target exceedance rate. EVT is useful when you care only about extremes, but you must confirm tails are stable per entity.
Backtesting checklist for scarce labels
If you only have a handful of confirmed incidents, backtesting still works if you evaluate operationally:
- Replay history with the detector frozen and count alerts per day/week per service.
- Measure “alert density” around known incidents: do alerts cluster in the incident window or are they uniformly noisy?
- Track alert-to-action ratio: what fraction produced a concrete follow-up (ticket, rollback, mitigation)?
- Audit top false positives: take the top 20 alerts by score and categorize why they were non-actionable (expected business error, deploy noise, dependency blip, duplicate storm).
Noise KPIs to monitor after deployment
Instead of chasing AUC, track metrics that correlate with trust:
- Alerts per on-call shift (by severity), with a target ceiling agreed by the team.
- Percent of alerts acknowledged then muted within 7 days (a strong signal of low actionability).
- Duplicate rate: fraction of alerts that map to an already-open issue fingerprint.
- Time-to-triage: if alerts are clear, this should drop even if alert count stays similar.
Validation loop with minimal labeling effort
A pragmatic approach is “micro-labeling”: require 10 to 30 labels per week, not hundreds. Each label is just one of: real issue, expected behavior, duplicate, unclear. Feed these labels into threshold adjustments and ignore rules, and keep a short changelog so you can roll back threshold changes that spike noise.
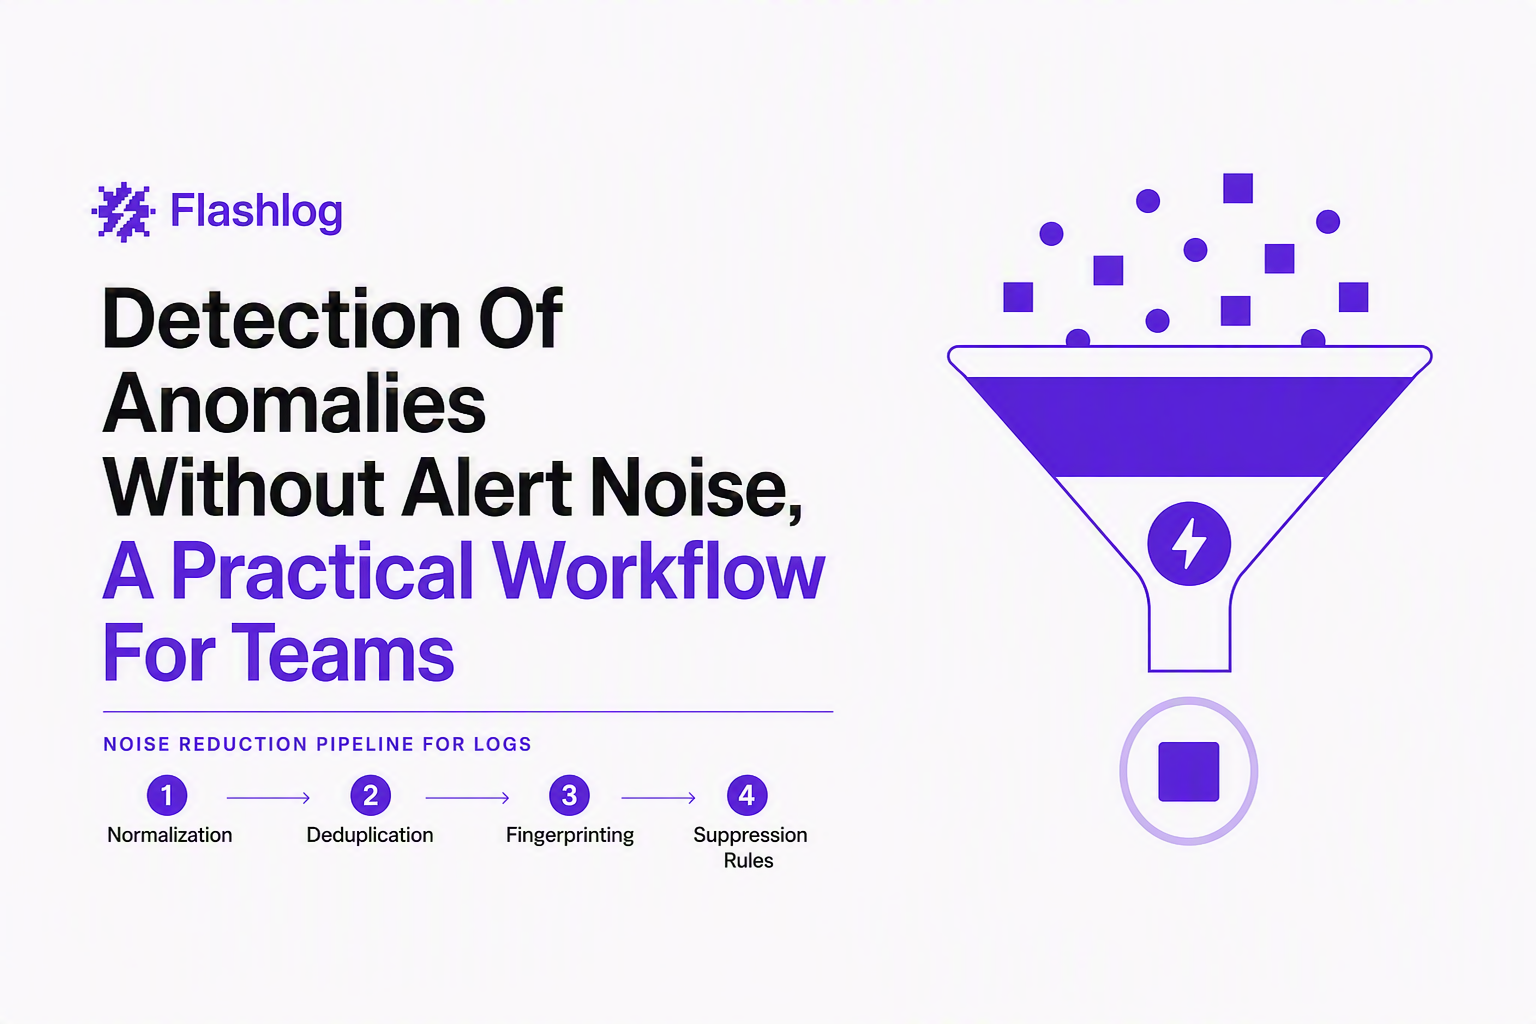
Anomaly Detection In Logs And Telemetry Needs Noise Reduction Before Modeling
Noise reduction is the fastest way to improve detection of anomalies in logs because duplicates, expected failures, and low-context events dominate alert volume.
Preprocessing pipeline that consistently cuts false alerts
- Normalize: canonicalize URLs (strip IDs), bucket status codes (4xx/5xx), standardize exception messages.
- Deduplicate: collapse identical events in a short window so you do not score the same failure 200 times.
- Group by fingerprint: create a stable key from stack trace, endpoint, and error class so repeats become one evolving issue with an occurrence count.
- Suppress expected business outcomes: payment declines, validation failures, rate limits should be muted by default unless they exceed a business-defined threshold.
- Add context features: release version, dependency health, customer tier, region, and user-journey step often explain spikes.
Seasonality and streaming constraints
- Use per-entity baselines (service or endpoint), otherwise a noisy endpoint will dominate global thresholds.
- Choose window sizes by action latency: 1 to 5 minutes for paging-worthy endpoints, 15 to 60 minutes for trend issues, daily for capacity anomalies.
- Plan for missing data: treat gaps explicitly to avoid “missing equals anomaly” pages during deploys or telemetry outages.
Where noise control fits in the workflow
Most teams route raw events directly into tickets and chat alerts, then try to “triage harder.” A better architecture inserts a decision layer that can ignore known patterns, group repeats, and hold back low-confidence signals before they reach Jira or Slack. If you want a deeper model-and-threshold view of this decision layer, see anomaly detection.
A Minimal End-To-End Python Workflow You Can Adapt This Week
A minimal workflow for detection of anomalies can be built with robust baselines, quantile thresholds, and a backtest loop that reports expected alert volume before you ship.
Dataset shape and assumptions
Assume you have a table with columns: timestamp, entity (service/endpoint), value (metric), and optional release. The example below uses pandas plus STL decomposition for seasonality.
Copy-paste baseline and scoring
import pandas as pd
import numpy as np
from statsmodels.tsa.seasonal import STL

# df: timestamp, entity, value
# Ensure time index per entity

def robust_zscore(resid):
    med = np.median(resid)
    mad = np.median(np.abs(resid - med))
    return (resid - med) / (1.4826 * mad + 1e-9)

scores = []
for ent, g in df.sort_values("timestamp").groupby("entity"):
    s = g.set_index("timestamp")["value"].asfreq("1min")
    s = s.interpolate(limit=5)  # small gaps

    # seasonal period: adjust to your data; here 1440 for daily minute data
    stl = STL(s, period=1440, robust=True)
    r = stl.fit()

    z = robust_zscore(r.resid.dropna())
    out = pd.DataFrame({
        "timestamp": z.index,
        "entity": ent,
        "value": s.loc[z.index].values,
        "score": np.abs(z.values)
    })
    scores.append(out)

scored = pd.concat(scores, ignore_index=True)
Quantile thresholding with a volume target
# Choose a target alert rate per entity, e.g., 0.1% of minutes
q = 0.999

thresholds = (
    scored.groupby("entity")["score"]
    .quantile(q)
    .rename("threshold")
    .reset_index()
)

scored = scored.merge(thresholds, on="entity", how="left")
scored["is_alert"] = scored["score"] >= scored["threshold"]

# Expected volume
volume = scored.groupby("entity")["is_alert"].mean().rename("alert_rate")
print(volume.sort_values(ascending=False).head(10))
Backtest output you should review before going live
- Top entities by alert_rate: noisy endpoints should be separated or get stricter suppression rules.
- Alert clusters: plot alerts vs deploy timestamps to see if you are mostly detecting deploy churn.
- Sample of alerts: inspect 20 alerts with the highest scores and label them using the four-class micro-label scheme.
When we tested this baseline-first approach, the biggest improvement came from per-entity thresholds and robust residual scoring, not from tuning exotic model hyperparameters.
Operationalizing Detection Of Anomalies From Alert To Root Cause
Operationalizing detection of anomalies requires routing rules, a feedback loop for labels, and drift checks so alert quality does not decay after the first month.
Design the routing policy by confidence and impact
Use a simple policy matrix to decide where alerts go:
- High confidence + high impact: page or high-priority incident channel.
- High confidence + low impact: create a ticket with grouping and context.
- Low confidence + high impact: send to a review queue with supporting evidence, not to on-call.
- Low confidence + low impact: store only, no notification.
This is where alert management and alert triage practices matter more than another model iteration.
Close the loop with lightweight labels and guardrails
- Label at the point of action: acknowledge alert with one of (real, expected, duplicate, unclear).
- Turn “expected” into suppression: add an ignore rule or business-outcome rule, not a silent shrug.
- Turn “duplicate” into grouping: adjust fingerprinting so repeated failures roll into one issue thread.
- Audit “unclear” weekly: unclear alerts indicate missing context features or too-low thresholds.
Drift monitoring that is actually actionable
- Score distribution shift: if the score histogram shifts, your baseline assumptions changed.
- Entity cardinality growth: new endpoints/customers can explode alert volume without a model bug.
- Mute rate: a rising mute rate is a leading indicator of alert distrust.
For teams struggling with chronic noise, the fastest win is often cutting false positives with rules and grouping before you tighten thresholds.
| Stage | Output artifact | Owner | Pass criteria |
|---|---|---|---|
| Frame the anomaly | Cost matrix + alert action sentence | Service owner + on-call lead | Action is clear; false-page cost agreed |
| Choose method | Detector family + features | Data/ML + SRE | Explains signal; fits latency and drift |
| Threshold + backtest | Target alert volume + replay report | SRE | Alert rate within budget; top FPs categorized |
| Noise controls | Ignore rules + fingerprints | Platform/observability | Duplicate storms grouped; expected outcomes muted |
| Operate | Label loop + drift checks | On-call rotation | Mute rate stable; triage time trending down |
FAQ on detection of anomalies
If you want to apply this workflow to production logs faster, Flash Log adds an automated capture-and-classification layer that can record bugs even when users do not report them, group repeated failures into one issue, and filter expected or low-confidence signals before they become noisy tickets or alerts.
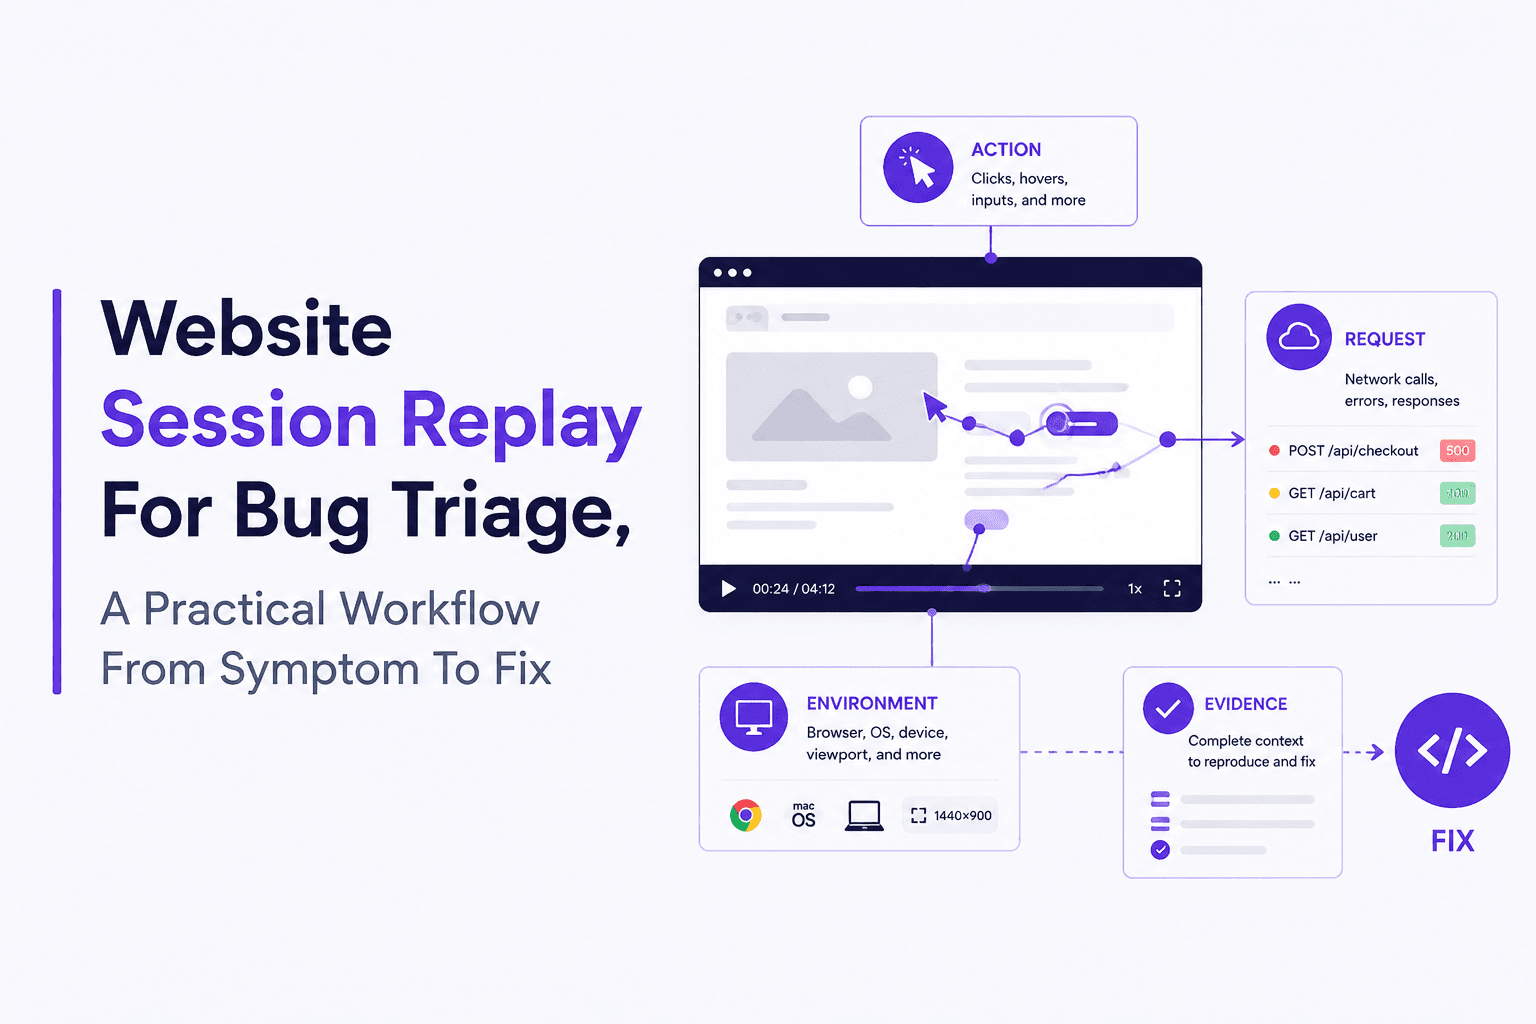
Website Session Replay Explained With a Real Example and a Setup Checklist
Learn website session replay basics, a real bug-to-fix walkthrough, and a privacy-safe setup checklist for collecting and using replay data.
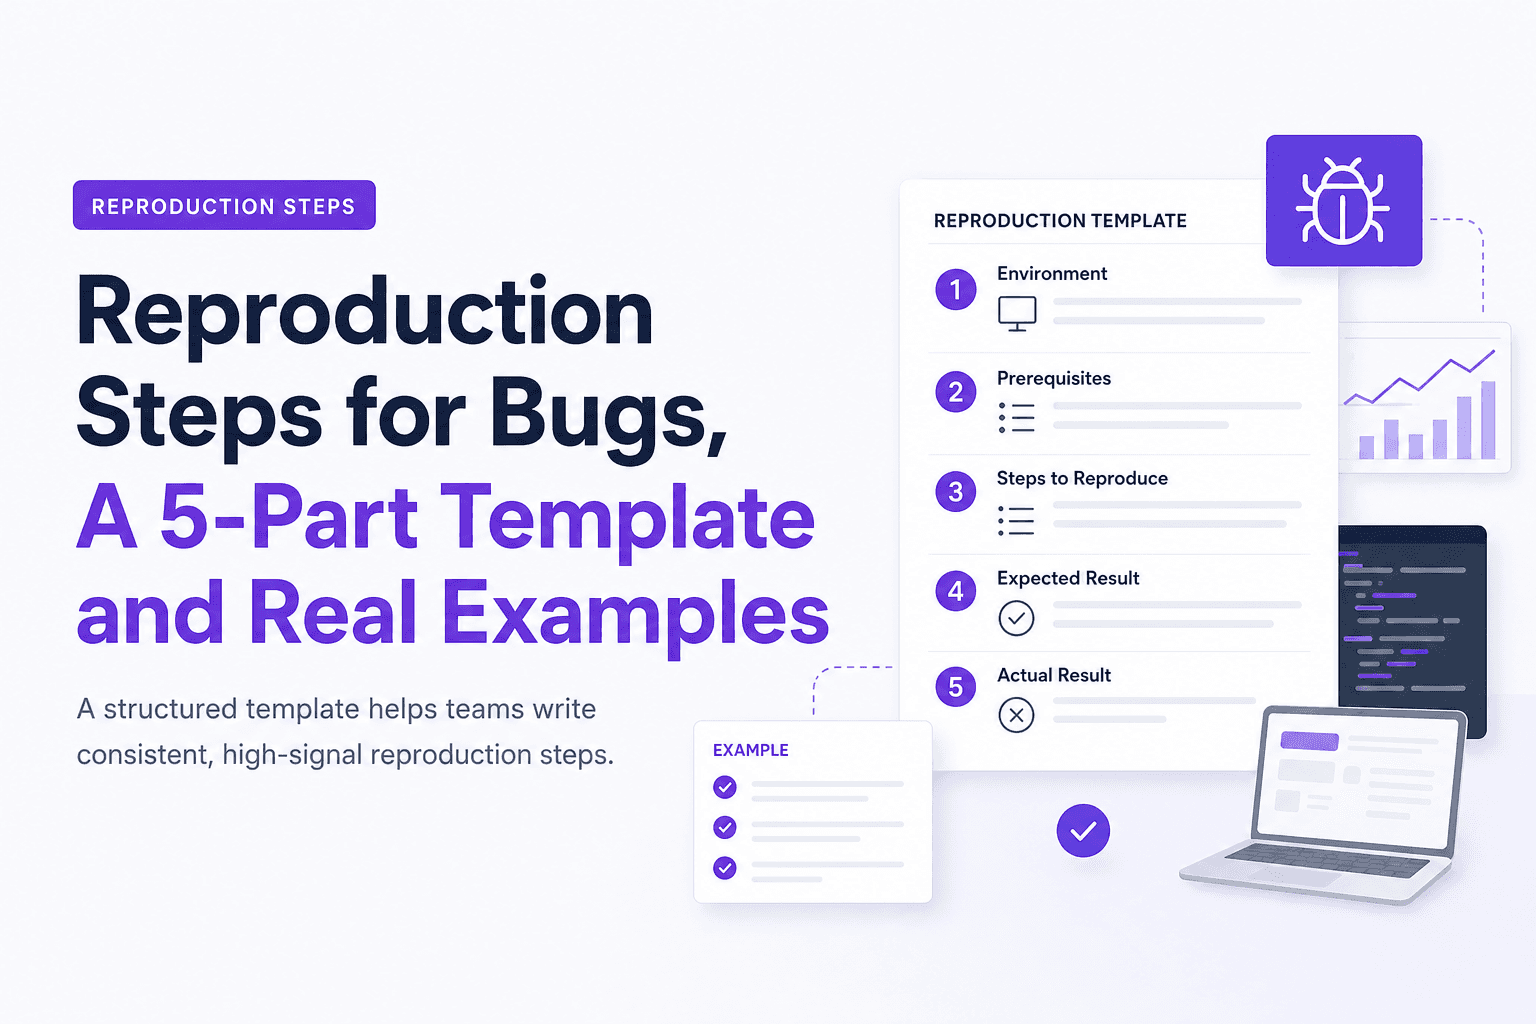
Reproduction Steps for Bugs, A 5-Part Template and Real Examples
Learn reproduction steps that engineers can actually follow: a 5-part template, diagram, and real web, mobile, and API examples.
Stacktraces Explained, How To Read Them Across Python, Java, JavaScript, and C#
Learn how to read stacktraces fast: find the useful frame, reduce noise, handle missing symbols, and share redacted traces safely.