
Stacktraces Explained, How To Read Them Across Python, Java, JavaScript, and C#
Stacktraces are the fastest way to pinpoint where code failed, but in production they often look noisy, truncated, or stripped of line numbers, making the “real” bug feel hidden.
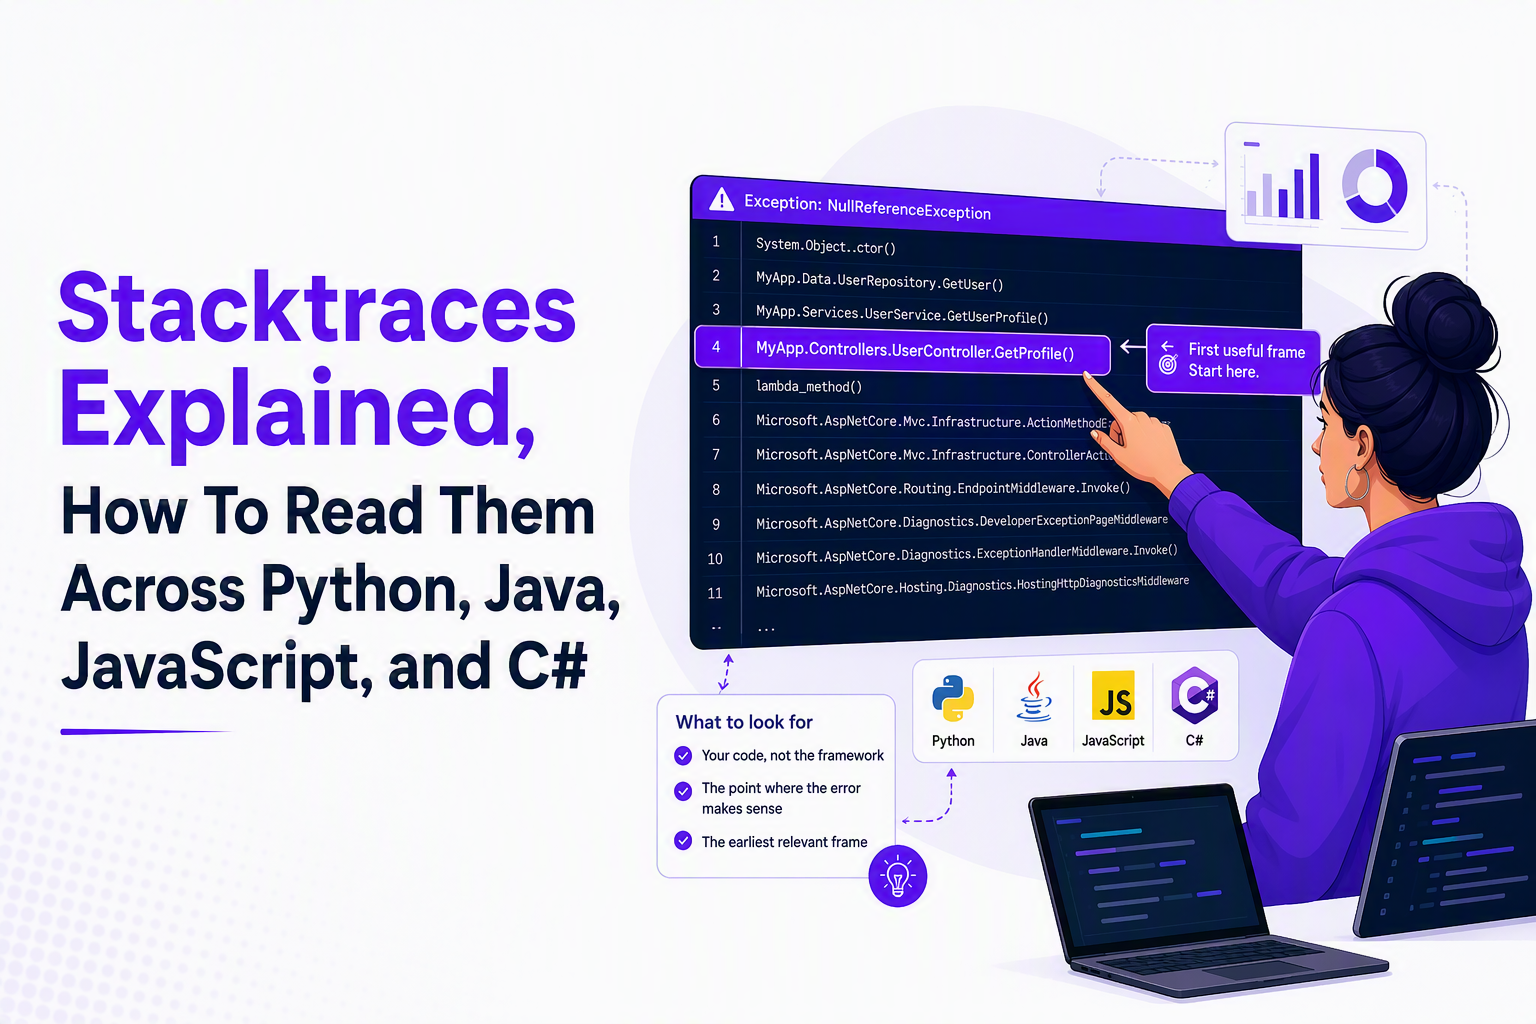
- Start with the first actionable frame in your code (not the first line of the trace) and work upward to confirm the trigger.
- Preserve formatting when opening stacktrace files so you can search, fold, and copy frames without losing indentation.
- When stacktraces lose meaning in production (minified JS, missing symbols), fix the build pipeline: sourcemaps, PDBs, and proper symbol upload.
What Stacktraces Are And Where They Show Up
A stacktrace (also called a stack trace or backtrace) is the recorded sequence of function/method calls that led to an error. It shows where the error was thrown and the path the code took to get there, which is why it’s such a core debugging artifact for bug detection and tracking. You generally want stacktraces logged in production, but stored securely and paired with just enough context (request, user action, release/build) to reproduce; never expose raw stacktraces to end users because they can leak implementation and sensitive details.
Where you will typically see them
- Server logs: a web request triggers an exception and the backend prints a trace (common in Python, Java, C#).
- Browser console: a runtime error prints a stack in DevTools (JavaScript).
- Crash reporters: mobile and desktop apps capture crash stacktraces, often symbolicated later (Android, iOS, desktop).
- CI test output: failing unit or integration tests print a trace with line numbers.
Why production stacktraces feel harder than local ones
- They include framework internals (hundreds of frames in web servers, ORMs, UI frameworks).
- They cross async boundaries (promises, tasks, event loops), which can reorder what “happened first”.
- They can be de-symbolicated (no line numbers, minified bundles, missing debug symbols).
- They are sometimes truncated (log limits, message size limits, or reporters that cap frames).
In practice, the job is not “read every line”; the job is “extract a minimal explanation: what failed, where in our code, and what input or state likely triggered it.”
How To Find The First Useful Frame And Root Cause
The fastest way to debug stacktraces is to identify the first frame that points to code you own and treat everything below it as symptom, not cause.
A 4-step triage pass you can do in under 2 minutes
- Confirm the exception type and message: e.g.,
NullReferenceException,TypeError: x is not a function,KeyError. This tells you what kind of failure you are dealing with (null, type, missing key, timeout, etc.). - Find the crash point frame: the frame where the exception was thrown (often the topmost frame in Python, C#, Java; in JS it depends on the environment).
- Locate the first “your code” frame: the first file/module/namespace/package that belongs to your repository, not the framework or runtime.
- Walk upward to validate the trigger: look at 1 to 3 caller frames above your code frame to understand how you got there (endpoint, UI action, job runner, message handler).
Criteria for “first useful frame”
- File path includes your repo or service name (for example
/app/,src/, your company namespace). - Package name is not a framework (not
django,spring,System.*,react-dom). - Line number exists and maps to a real line in the deployed build (not a line in a minified bundle unless you have sourcemaps).
A concrete micro-example (how the “first line” can mislead)
If a trace starts inside a JSON parser, the bug is often not “the parser is broken”. It is usually that your code passed invalid JSON because an upstream handler returned HTML, an error page, or a truncated payload. The “first useful frame” is where you call json.loads (Python) or JSON.parse (JS), then you check what the input actually was.
What surprised our team was how often the caller frame (the line that used a value) was correct, and the real fix lived one frame earlier where the value was constructed or fetched without validation.
When root cause is above the first useful frame
Some stacktraces point to your code, but the true cause is earlier: a bad config value, an unexpected request shape, or a missing database row. A simple rule: if the exception is a “use-site” failure (null, key missing, index out of range), check the frame where the data was created, parsed, or returned, not only where it was accessed.
How To Open A Stacktrace File Without Losing Format
Opening stacktrace files correctly matters because indentation, line breaks, and mono-spaced alignment make frames searchable and copyable during triage.
File types you might receive
- .log: often multi-line entries mixed with other logs.
- .txt: pasted traces exported from consoles or error dialogs.
- .stacktrace: convention used by some tools, usually plain text.
Checklist: preserve the parts that debugging depends on
- Keep monospaced formatting: use an editor that shows whitespace clearly (VS Code, Sublime, JetBrains IDEs, Notepad++).
- Disable word wrap temporarily: wrapped lines make it hard to see file, line, and method boundaries.
- Normalize line endings: if a trace looks like one long line, convert CRLF/LF properly (most editors offer this in the status bar).
- Search by “at ” or “File ”: most languages have a consistent frame prefix you can jump through quickly.
Practical “do this, not that” for common workflows
- Slack/Teams paste: prefer uploading a file or pasting in a code block so stacktraces do not lose indentation.
- Email exports: save as a file first, then open in an editor, because email clients often collapse whitespace.
- Issue tracker: paste into fenced code blocks and include the exception line plus 20 to 60 frames, not just the top 3 lines.
Stacktraces In Python, Java, JavaScript, And C# At A Glance
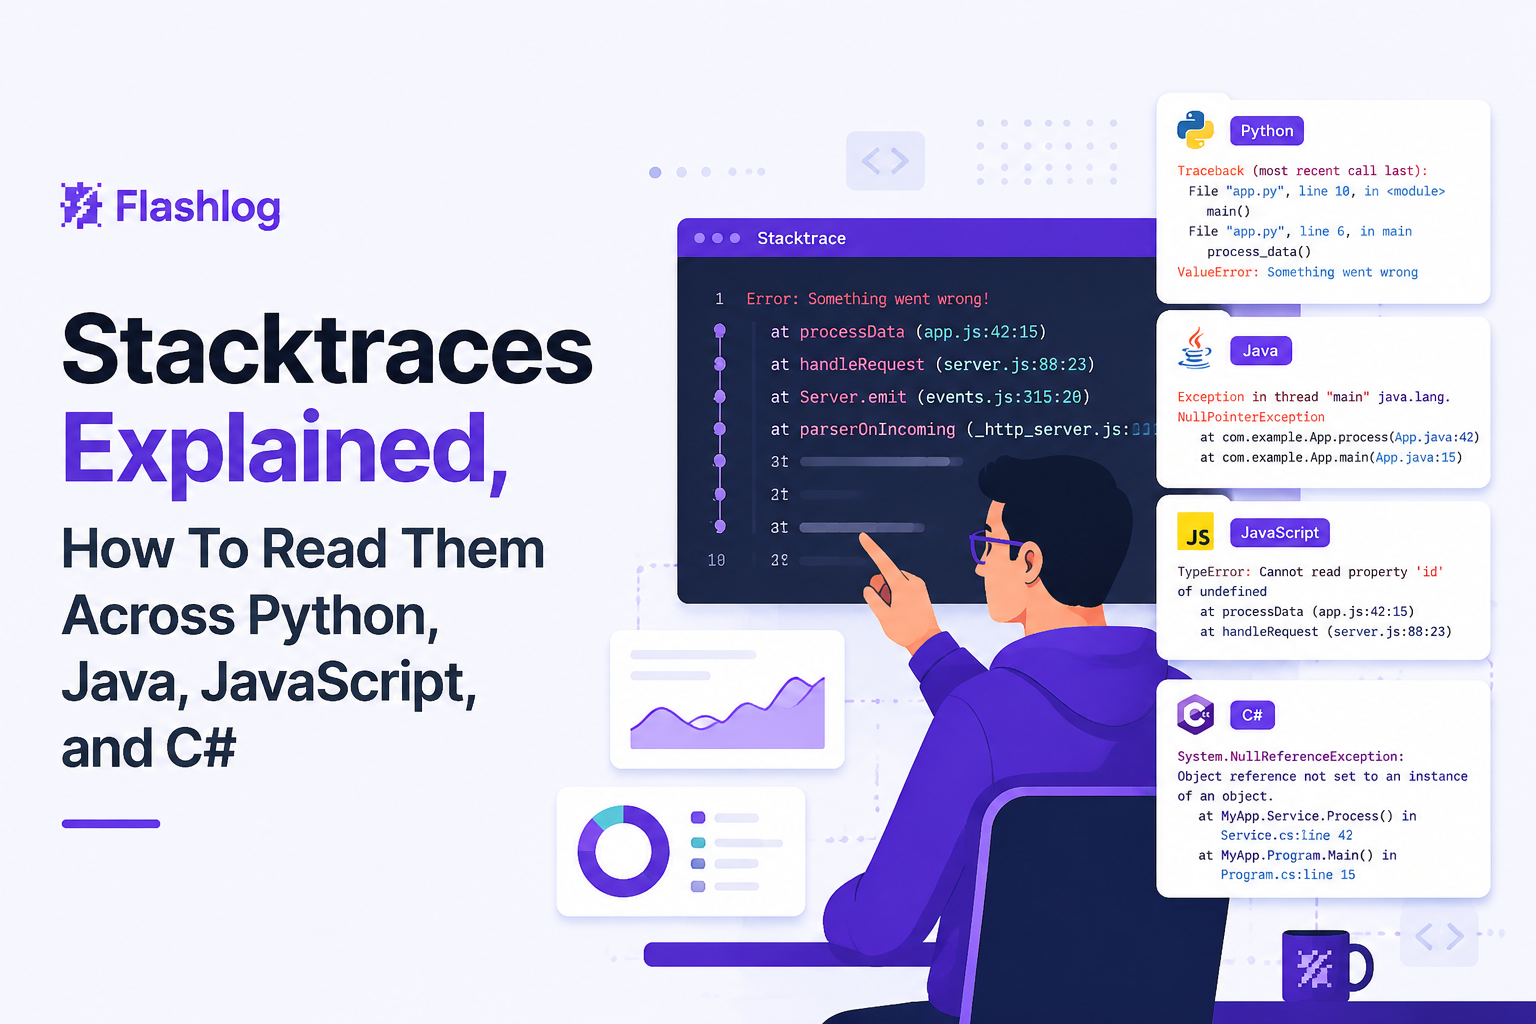
Stacktraces differ most by frame order, frame syntax, and how async calls show up—but in production the bigger difference is whether you can see your source context (and jump to the right commit) or you’re stuck with opaque frames. Many teams read stacktraces inside error/bug tools that enrich frames with surrounding code, link stacks to a repo, and only become accurate when the trace is tied to the right release/build plus the correct symbols/sourcemaps.
What to look for first in each language
- Python: the last line is the exception type and message; the most relevant frames are often at the bottom, closest to the error.
- Java: the exception is at the top, followed by
at package.Class.method(File.java:line); “Caused by” chains matter a lot. - JavaScript: browser stacks vary, but you usually see
at function (file:line:col); minified bundles require sourcemaps to be meaningful. - C#/.NET:
System.Exceptionand “at Namespace.Class.Method in File:line” when symbols are present; inner exceptions provide the real origin.
Related deep dives (optional but useful)
If you want more targeted practice, see stack trace basics, a hands-on stack trace example walkthrough, and how unhandled exceptions typically reach production.
How To Ignore Framework Noise And Async Boundaries
Framework noise becomes manageable when you treat stacktraces as an input to bug tracking, not just something a human reads once. In practice, teams reduce alert fatigue by grouping/deduping similar stacktraces into one “issue” (same exception + similar frames) and then filtering the view to show “in-app frames first” while keeping a toggle for full framework frames and the raw trace when needed. This matters because async stacks and missing symbols can cause the same underlying bug to look like multiple different traces across releases, so capturing async stack traces (when available) and keeping release/build identifiers consistent improves both grouping accuracy and triage speed.
A simple marking system for noisy traces
- Mark your ownership boundary: first frame that is your module/namespace.
- Mark platform boundary: runtime and framework frames (web server, UI framework, ORM, HTTP client).
- Mark async boundary: places where execution hops threads/tasks/events (JS promises, .NET async, Java futures).
Common noise patterns and what to do
- Long middleware chains: in web servers, many frames are routing and filters. Jump to the handler function that your route maps to.
- ORM internals: database call stacks can bury the query origin. Search for the repository/service method that initiated the call.
- Repeated “invoke” frames: these are framework dispatch loops. Skip until you hit your callback or controller.
Async boundaries: how to keep cause and effect together
- JavaScript: an error might surface in a promise continuation while the real trigger is earlier (input parsing, state update). If available, use browser “async stack traces” support in DevTools so you can see the chain across awaits.
- .NET: look for
MoveNextframes and focus on the first frame that points back to your source file line. If you only see framework methods, you likely lack symbols.
After running a few production incident reviews, the pattern was clear: teams fix issues faster when they capture the failing request or UI action alongside the stacktrace, because async gaps stop being guesswork.
For a compact process to decide what deserves attention first, link your trace reading to issue triage and a repeatable debugging workflow so the same stacktraces do not bounce between people.
When Stacktraces Lose Line Numbers, Symbols, Or Meaning
Production stacktraces lose usefulness when builds strip symbols, minify/transpile bundles, or ship compiled artifacts without the mapping needed to get back to real source lines. The fix is usually in your release pipeline: generate the right symbols/sourcemaps, upload them to wherever you view errors, and ensure every event includes a release/build identifier so the tooling can match “this stack” to “that exact build” (otherwise source-in-trace links won’t land on the correct lines).
Three common causes and the corresponding fix
- JavaScript minification without sourcemaps: a trace points to
app.min.js:1:12345. Fix by generating sourcemaps and making them available to your error tooling and on-call workflow. Mozilla’s introduction to sourcemaps is a solid reference: MDN source maps. - .NET missing PDBs: you see method names but no file and line. Fix by producing and deploying PDBs appropriately (and storing them securely), then ensuring your crash/log pipeline can use them to resolve line numbers.
- Native or Android “unsymbolicated” traces: frames show memory addresses or generic methods. Fix by uploading mapping files or symbols (for Android, ProGuard/R8 mapping; for native, dSYM/ELF symbols depending on platform).
A quick “meaningfulness test” before you spend 30 minutes
- At least one frame points to your source file with a line number you can open.
- The exception message is specific (not only “Unknown error” or “Script error”).
- The trace is tied to a release/build identifier so you know which code version produced it.
If all three fail, stop and fix symbolication first; otherwise you will make guesses that do not reproduce.
Android Stacktraces And What To Redact Before Sharing
Android stacktraces are easiest to triage when you separate the fatal exception line, the “Caused by” chain, and the first application package frame.
How Android traces are typically structured
- Fatal exception header: thread name plus exception.
- Primary exception: the first block of frames.
- Caused by: one or more nested exceptions that often contain the real reason (for example an IO failure causing a higher-level crash).
- Frames with package names: look for your app’s package, then the first frame under it is often the best entry point.
Safe-sharing checklist (what to redact before posting publicly)
- User identifiers: emails, phone numbers, user IDs, device IDs.
- Auth and secrets: tokens, API keys, session IDs, cookies, Authorization headers.
- Full URLs with query params: keep the endpoint path, redact sensitive params (especially reset links and signed URLs).
- File paths and internal hostnames: these can leak environment structure.
What you should keep for reproducibility
- App version/build number, Android version, device model, and ABI if relevant.
- The smallest set of steps that leads to the crash (3 to 7 steps).
- The top 30 to 80 frames including “Caused by” blocks, so the ownership boundary is visible.
| Language | Frame pattern to search for | Where the actionable frame usually is | Production gotcha |
|---|---|---|---|
| Python | File "...", line N, in func | Near the bottom, closest to exception | Tracebacks can be cut off by log limits |
| Java | at pkg.Class.method(File.java:N) + Caused by | First frame under your package in the deepest cause | Root cause often hides under multiple causes |
| JavaScript | at func (file:line:col) | First non-framework frame once sourcemaps work | Minified bundles without sourcemaps are nearly opaque |
| C# | at Namespace.Class.Method in File:line N | First frame with a source file and line number | Missing PDBs remove file:line context |
| Android | FATAL EXCEPTION + Caused by + package frames | First frame in your app package under the real cause | R8/ProGuard requires mapping for readable stacks |
FAQ
If you want stacktraces and production bugs captured automatically even when users do not report them, Flash Log can record failures with the surrounding context and help classify real issues so engineering starts from a clean, ticket-ready starting point.
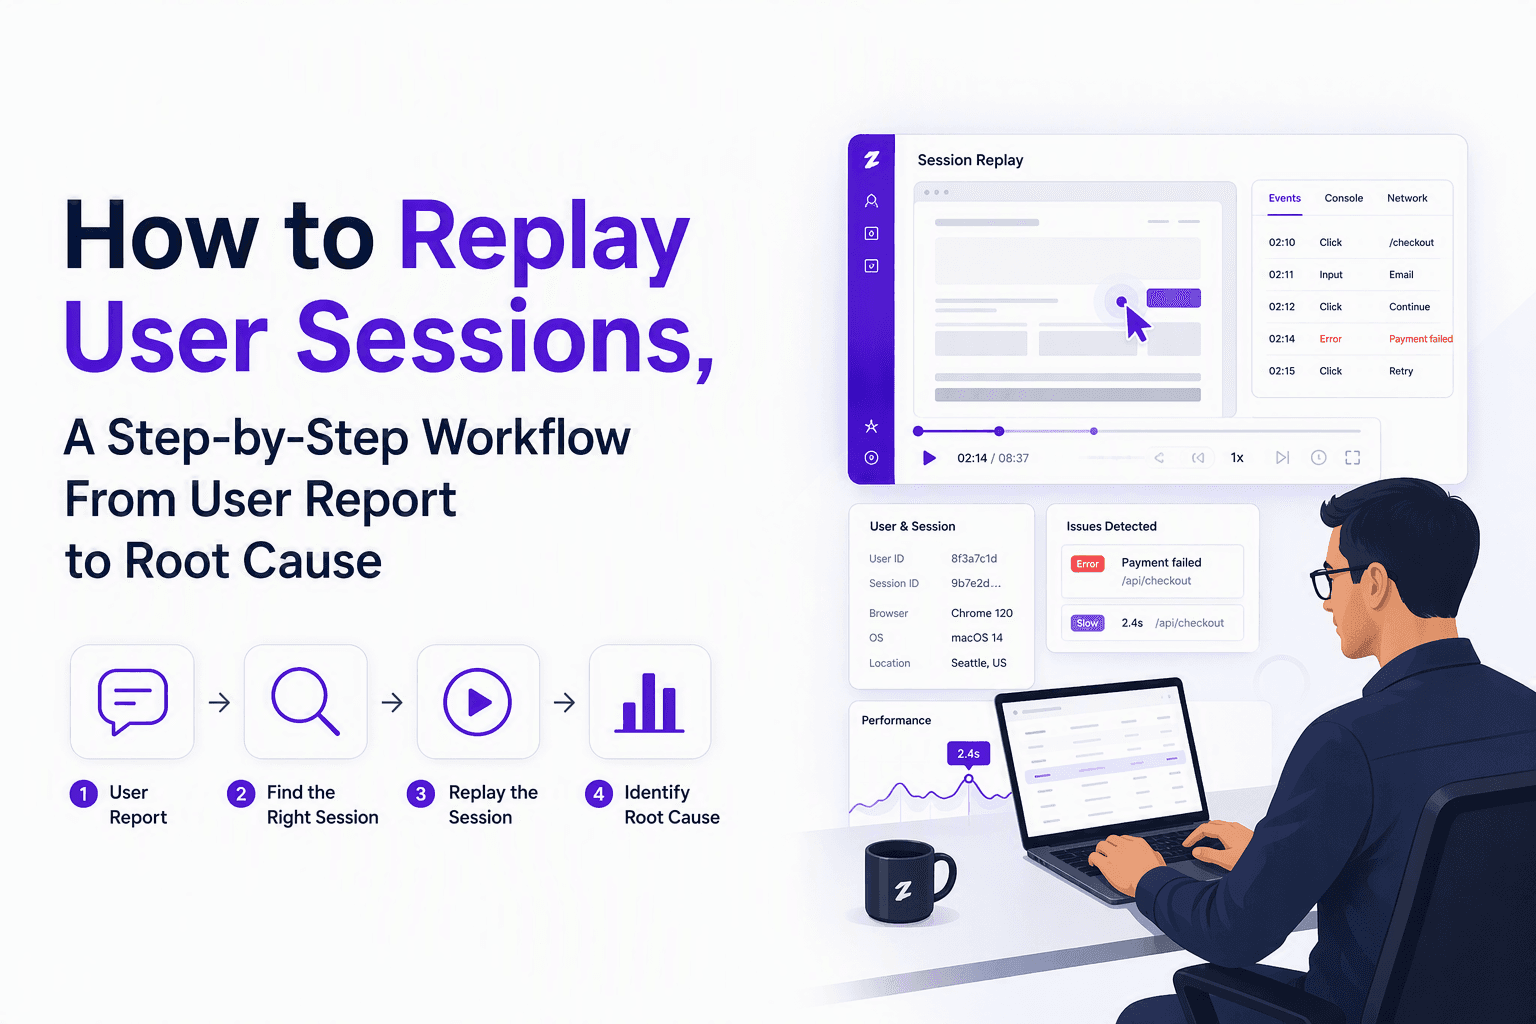
How to Replay User Sessions, A Step-by-Step Workflow From User Report to Root Cause
Learn how to replay user sessions with a practical workflow: find the right session, review signals, document findings, and share safely.
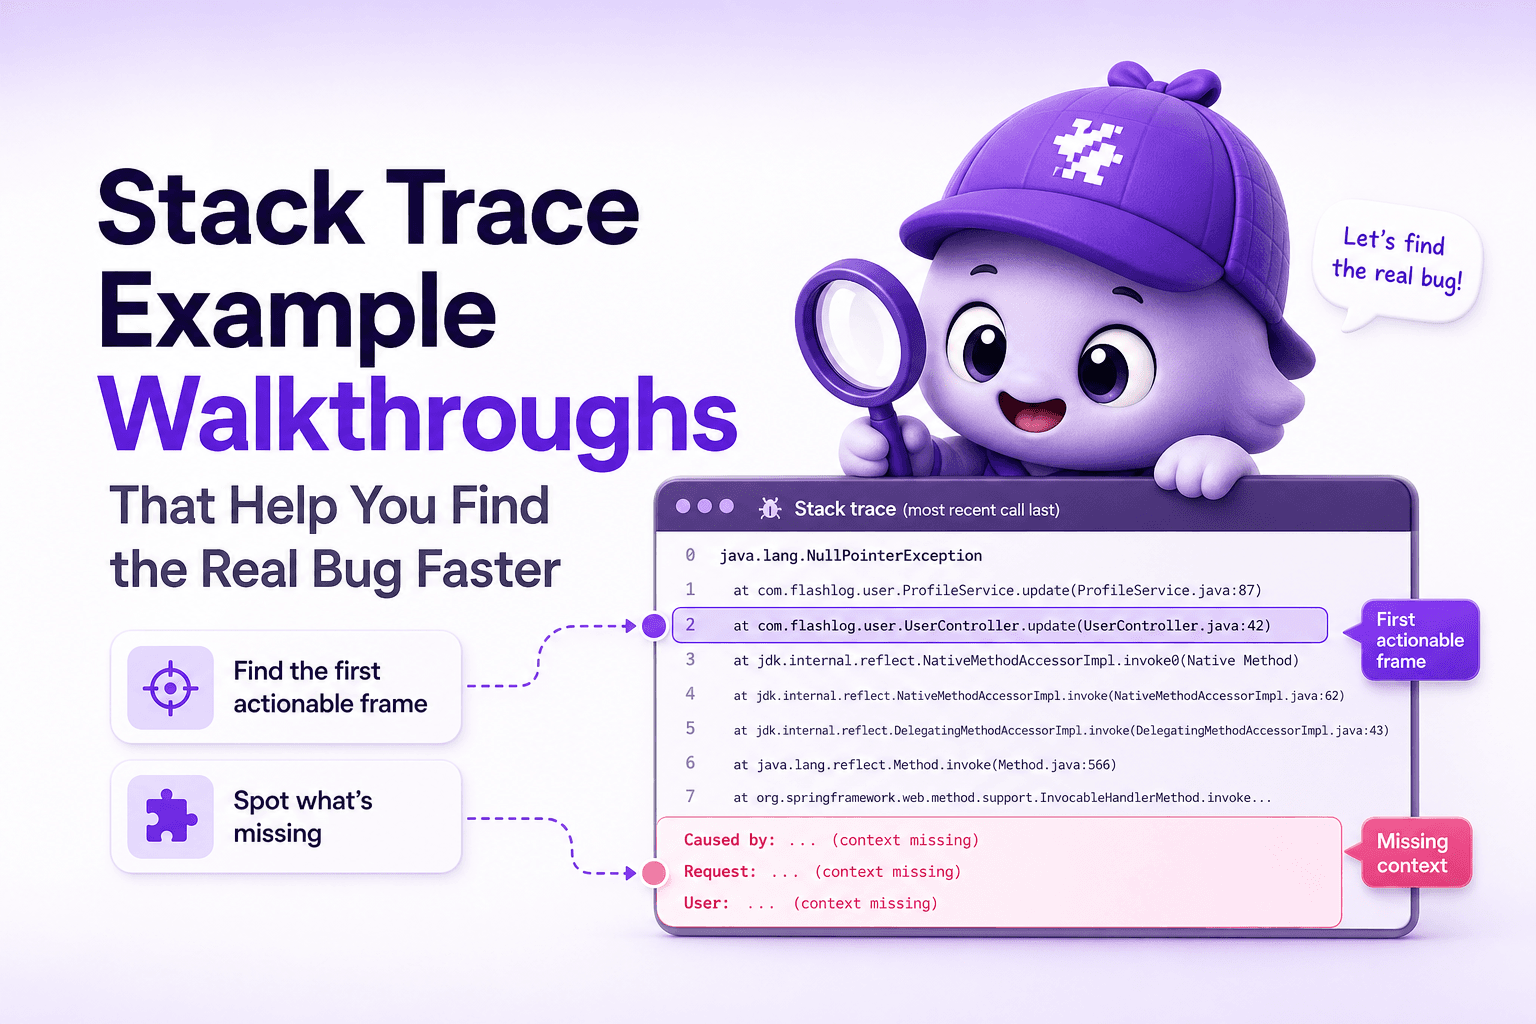
Stack Trace Example Walkthroughs That Help You Find the Real Bug Faster
Learn how to read a stack trace example in production, spot the first actionable frame, and gather the missing context to fix bugs faster.
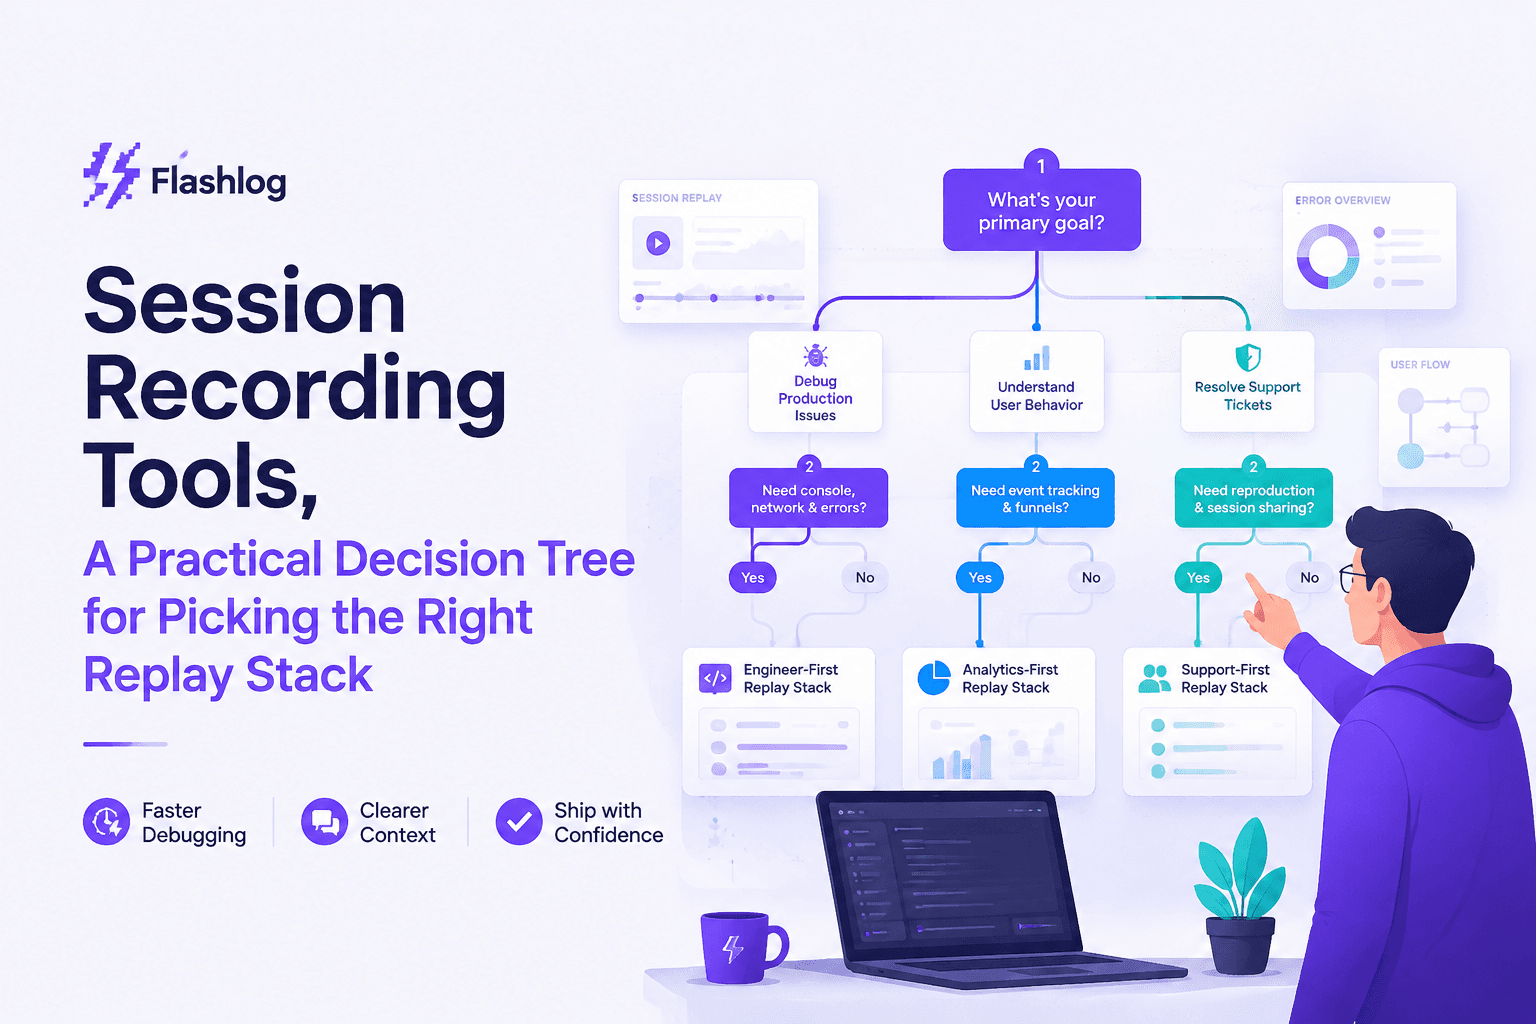
Session Recording Tools, A Practical Decision Tree for Picking the Right Replay Stack
Choose session recording tools with a 60-second decision tree and a pilot checklist for speed-to-root-cause, privacy controls, and performance impact.