
Alert Storm Explained, Causes, Risks, and How To Stop Alert Noise Fast
An alert storm is when monitoring tools generate so many alerts in a short window that humans cannot triage them fast enough, and the flood itself becomes the incident. The danger is not just annoyance: once teams stop trusting pages and pings, real outages hide inside the noise.
- An alert storm is a volume-and-velocity failure in your alerting system, usually triggered by duplicates, bad thresholds, or one broken dependency cascading across services.
- You can distinguish an alert storm from a real incident in about 10 minutes using blast radius, signal consistency, and user impact checks.
- A safe first-week fix order is dedupe first, then correlation, then threshold and window tuning, then routing and ownership so you reduce noise without losing coverage.
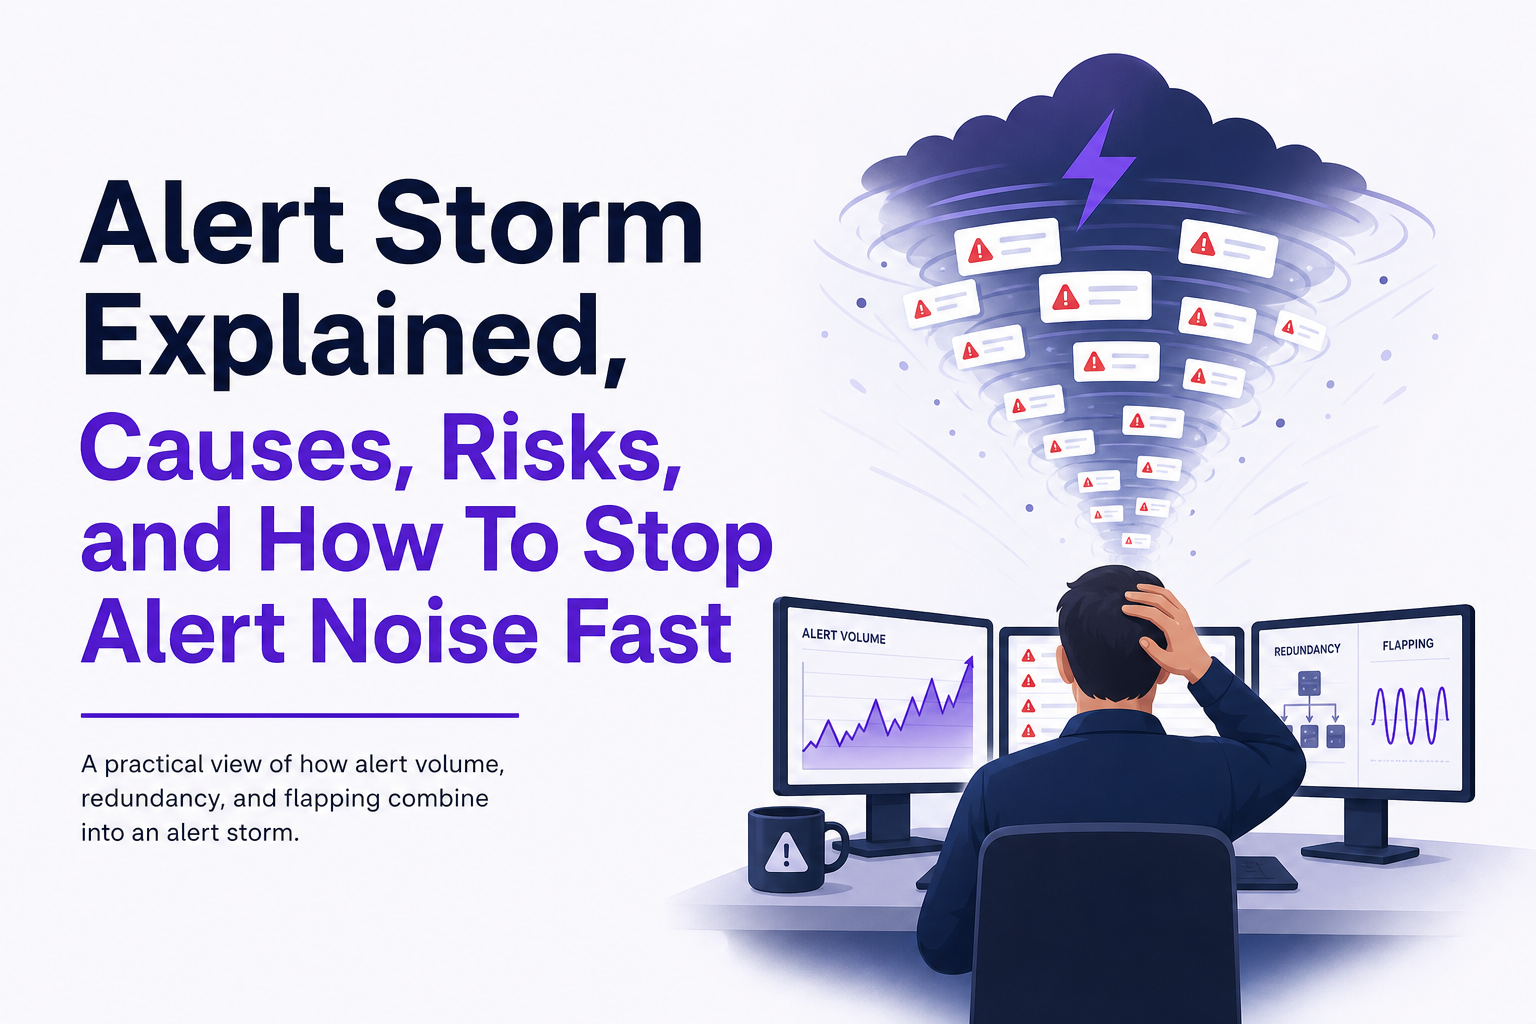
What an alert storm is and why it happens
Not every spike is an alert storm. A normal spike is a temporary increase in alerts that still maps to a small number of actionable causes. An alert storm is different: it produces more alerts than your on-call can process, and most of those alerts are duplicates, low-signal symptoms, or expected outcomes that should never have paged.
A practical definition you can use in runbooks
Use a definition that is measurable, not emotional. Here is one that works across stacks:
- Velocity: > 30 alerts in 10 minutes to the same team, or > 5 pages in 10 minutes to one on-call.
- Redundancy: > 50% of alerts share the same suspected cause (same endpoint, same dependency, same error class).
- Human overload: triage queue grows for 15+ minutes, or acknowledgements lag behind alert creation by 2x.
If you can’t measure it yet, start by tagging alerts with a “service”, “dependency”, and “error class” label so you can compute redundancy later.
Common root causes, mapped to what you will observe
Most alert storms come from a small set of failure modes. The table below makes it easier to diagnose quickly.
- Duplicate symptom alerts: one incident triggers 20 monitors (CPU, latency, 5xx, queue depth) that all page separately. Observation: many alerts fire at the same timestamp and resolve together.
- Bad thresholds or windows: thresholds set too tight, or evaluation windows too short. Observation: flapping alerts, frequent auto-resolve, and re-fire.
- Expected “business errors” treated as incidents: payment declines, validation failures, permission denials. Observation: high volume, low user impact, often tied to specific flows.
- Cascading dependency failures: one upstream outage causes multiple downstream services to fail. Observation: many services alert, but one dependency graph node is common.
- Retry loops and thundering herds: clients retry aggressively, multiplying error volume. Observation: request rate climbs while success rate falls, and the same error repeats.
- Deploy and config churn: a rollout changes metrics or log formats, breaking monitors. Observation: alerts start immediately after deploy, but user impact is unclear.
One important nuance: an alert storm can happen during a real incident, but it still needs separate handling because the storm blocks diagnosis.
How to tell alert storms from real incidents in 10 minutes
The fastest way to regain control is to run a short, repeatable triage decision tree. The goal is not perfect root cause in 10 minutes, it is to decide whether you should (a) declare an incident and focus, or (b) suppress noise and protect attention while you investigate.
The 10-minute decision tree
- Minute 0 to 2: Confirm user impact. Check one user-facing SLI: checkout success rate, API p95 latency, error rate, or sign-in success. If you don’t have SLIs, check a synthetic transaction or status page.
- Minute 2 to 4: Measure blast radius. Is it one service, one region, one endpoint, or everything? A wide blast radius with a single common dependency suggests a real incident, not random noise.
- Minute 4 to 6: Check signal consistency. Do alerts agree on the same story (same time window, same direction, same component), or are they contradictory and flapping?
- Minute 6 to 8: Look for a single “primary” alert. Identify one alert that is closest to user impact (SLO burn, error budget, failed synthetic). Everything else becomes secondary until proven otherwise.
- Minute 8 to 10: Decide and communicate. If impact is confirmed, declare an incident with one owner and silence secondary alerts. If impact is not confirmed, treat it as an alert storm until evidence says otherwise and start suppression safely.
A checklist for “storm smell”
- High count, low diversity: 200 alerts but only 2 to 3 unique error signatures.
- Flapping: firing and resolving repeatedly within 5 to 10 minutes.
- Symptoms without impact: infrastructure warnings with stable SLIs.
- All started at once: especially right after a deploy, config change, or dependency incident.
What surprised our team was how often the “storm smell” showed up during perfectly normal traffic spikes: the real problem was evaluation windows set to 1 minute, which turned harmless jitter into pages.
Tools that make the 10-minute call easier
- Dependency map: even a basic service graph helps you spot the common upstream node.
- Unified timeline: overlay deploy markers, error rate, latency, and alert fire times.
- Event grouping: cluster identical errors so you see one issue with an occurrence count, not 500 separate pings.
If you are drowning in noisy bug events that later become tickets, reducing false positives upstream is often the difference between a manageable queue and a week of backlog triage.
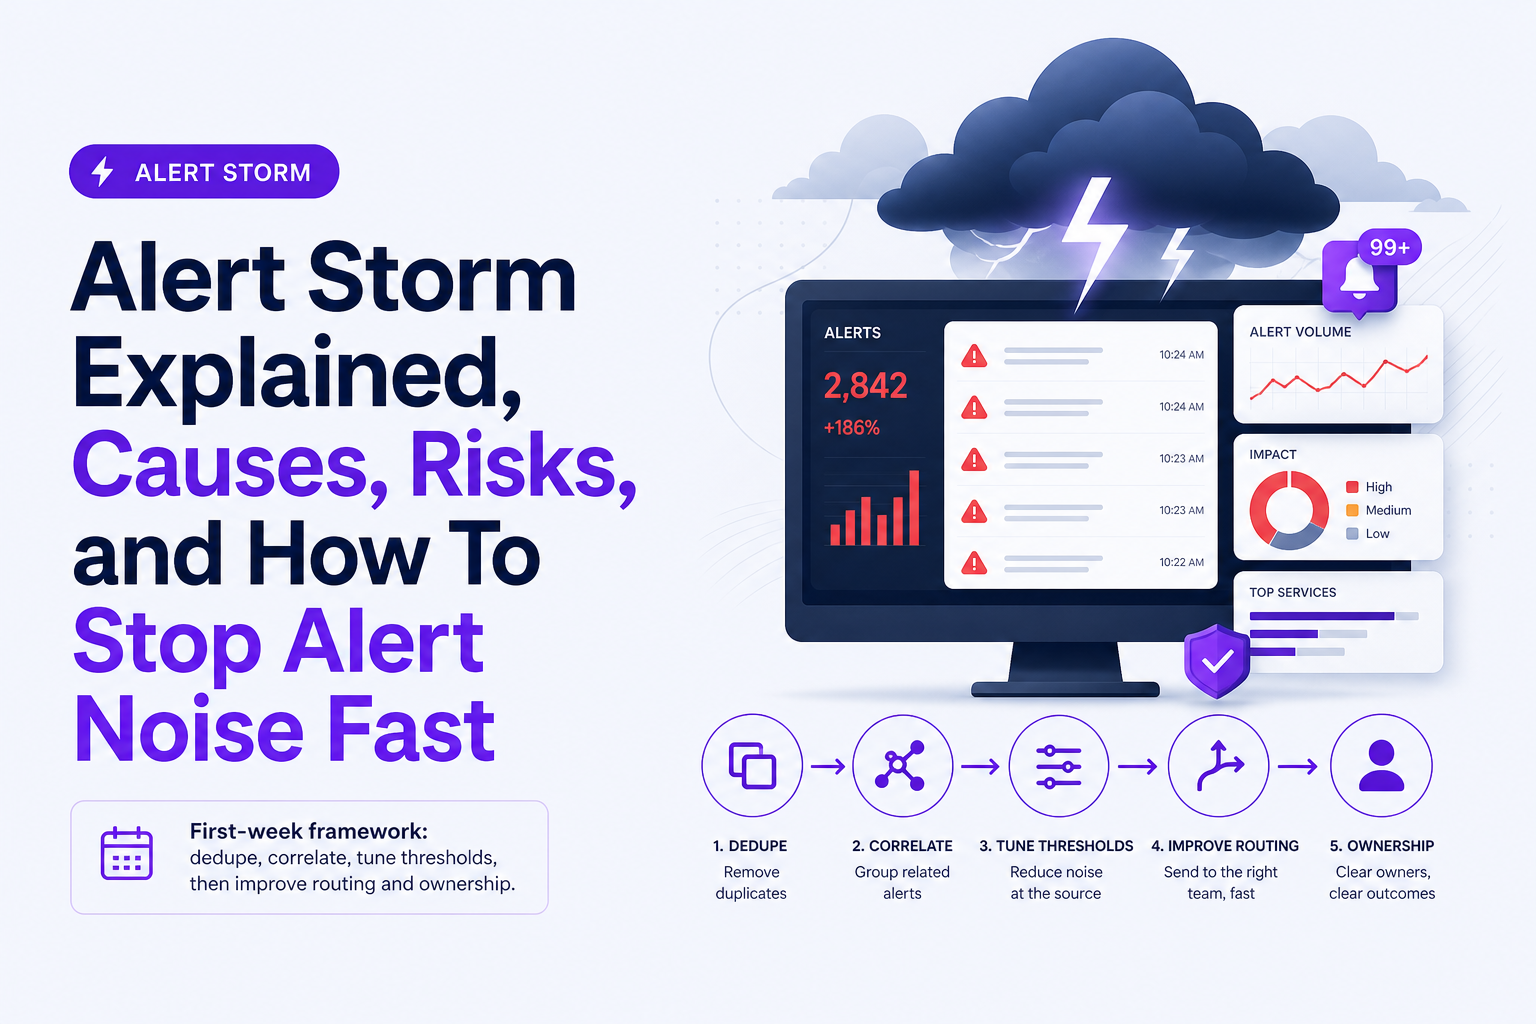
A first-week framework to reduce alert storms without losing coverage
Most teams try to “tune everything” and accidentally create blind spots. A safer approach is to reduce alert volume in a specific order, starting with changes that cannot hide real incidents. This first-week framework assumes you want fewer interruptions without losing the ability to detect real user impact.
Day 1 to 2: Dedupe first (lowest risk, highest relief)
Deduplication reduces repeated alerts for the same underlying event. It is the fastest way to stop an alert storm while keeping coverage intact.
- Choose a dedupe key: service + endpoint + error class (or exception type) + region is a solid default.
- Set a dedupe window: start with 10 to 15 minutes for pages, 5 minutes for chat notifications.
- Keep the count: replace 100 alerts with 1 alert that includes “occurrences: 100” and top samples.
Concrete example: instead of paging on every “POST /api/checkout 500”, page once per 15 minutes per region, and attach the rolling count and the first and last timestamps.
Day 2 to 3: Correlate into one narrative (reduce multi-monitor spam)
Correlation is grouping related signals into a single incident story. If dedupe handles “same alert repeated,” correlation handles “different alerts, same cause.”
- Pick a primary signal: one SLO burn alert or one user-journey synthetic failure should be the page.
- Attach secondary signals: CPU, queue depth, dependency timeouts become annotations, not pages.
- Correlate by time and topology: same 5-minute window plus shared dependency or shared deploy marker.
Correlation gets easier when you already practice log correlation and can connect one error signature to the user journey that triggered it.
Day 3 to 5: Tune thresholds and evaluation windows (where teams accidentally break coverage)
Threshold tuning is necessary, but it is where most coverage is lost. Use a controlled method:
- Use multi-window, multi-burn for SLOs: page on fast burn (for real incidents) and ticket on slow burn (for degradation). A good reference is Google’s SRE guidance on error budgets and burn rates: Alerting on SLOs.
- Increase evaluation window before raising thresholds: moving from 1 minute to 5 minutes often removes jitter-driven pages without hiding sustained failures.
- Add “for” durations: require the condition to hold for 3 to 5 minutes before paging.
- Use percent-based triggers: error rate > 2% is usually more stable than “errors > 50” across traffic swings.
In our experience working with teams that ship daily, the simplest win was changing “instant threshold” alerts into “5-minute sustained” alerts, which cut paging volume sharply while still catching every real outage because real outages do not resolve in 60 seconds.
Day 5 to 7: Fix routing, ownership, and noise at the source
Routing is how you keep an alert from becoming everyone’s problem. It also prevents storms caused by “broadcast alerts” to multiple channels.
- One alert, one owner: every page must map to a single on-call rotation, not a shared channel.
- Separate page vs notify: pages are for immediate action; chat notifications are for awareness; tickets are for follow-up.
- Mute expected outcomes: treat known business responses (declined payments, validation errors) as analytics, not incidents.
- Write a one-screen runbook: “What does this mean, how to confirm impact, top 3 causes, rollback steps.”
If your storm is coming from bug events rather than metrics, apply the same logic: group duplicates, ignore known harmless patterns, and hold low-confidence signals until they are corroborated. This is where structured issue triage practices prevent an alert storm from turning into a ticket storm.
Design alerts that do not create storms
The long-term fix is alert design. If alerts are not actionable, they will eventually produce an alert storm because teams compensate by adding more monitors, more channels, and more “just in case” notifications.
The actionable alert scorecard (use this before enabling any page)
Before an alert is allowed to page, it should pass these criteria:
- Clear user impact: tied to an SLI or user journey, not a raw resource metric.
- Single owner: one team and one on-call rotation.
- Decision attached: the alert implies an action (rollback, failover, scale, disable feature flag).
- Bounded noise: it dedupes and has a minimum duration.
- Runbook link: one link with confirm steps and first actions.
SLO-based paging rules that reduce alert noise
Resource alerts (CPU, memory) are often early warnings, but they should rarely page on their own. A robust pattern is:
- Page on SLO burn: when user impact is measurable.
- Notify on saturation: CPU, memory, queue depth go to chat with graphs, not a page.
- Ticket on slow degradation: long-term trends become backlog items.
We initially assumed paging on every infrastructure threshold would catch incidents earlier, but the data showed the opposite: it created alert storms that delayed the first real confirmation step, which should have been checking the user-facing SLI.
Storm-proofing patterns for common systems
- API gateways: alert on 5xx error rate by route group, not every route; dedupe by route group.
- Queues: page on “age of oldest message” and consumer lag, not raw depth alone.
- Databases: page on error rate and p95 latency for critical queries; notify on CPU or connection pool saturation.
- Frontend exceptions: group by fingerprint and release version; notify on new exception types, not total volume.
For frontend and runtime signals, it helps to treat runtime exceptions as a workflow: new, high-impact fingerprints get attention; repeats are tracked as one issue with an occurrence counter.
| Storm source | Fast containment | Long-term fix | What you should measure |
|---|---|---|---|
| Duplicate pages for the same error | Dedupe by service + error class + endpoint | Issue fingerprinting and grouping | Alerts per incident, unique fingerprints per day |
| Flapping thresholds | Add 3 to 5 minute “for” duration | Rebuild with SLO burn alerts | Flap rate, page rate, missed incidents |
| Cascading dependency failures | Correlate to one primary dependency alert | Dependency SLOs and circuit breakers | MTTA, time to identify upstream cause |
| Expected business errors | Mute or route to analytics | Explicit ignore rules by endpoint/status | % alerts with no action taken |
FAQ about alert storms
If your alert storm is being fueled by noisy production bug events and duplicate issue creation, Flash Log can act as a decision layer that filters expected failures, groups repeats into one evolving issue, and routes only actionable signals to the tools your team actually watches.
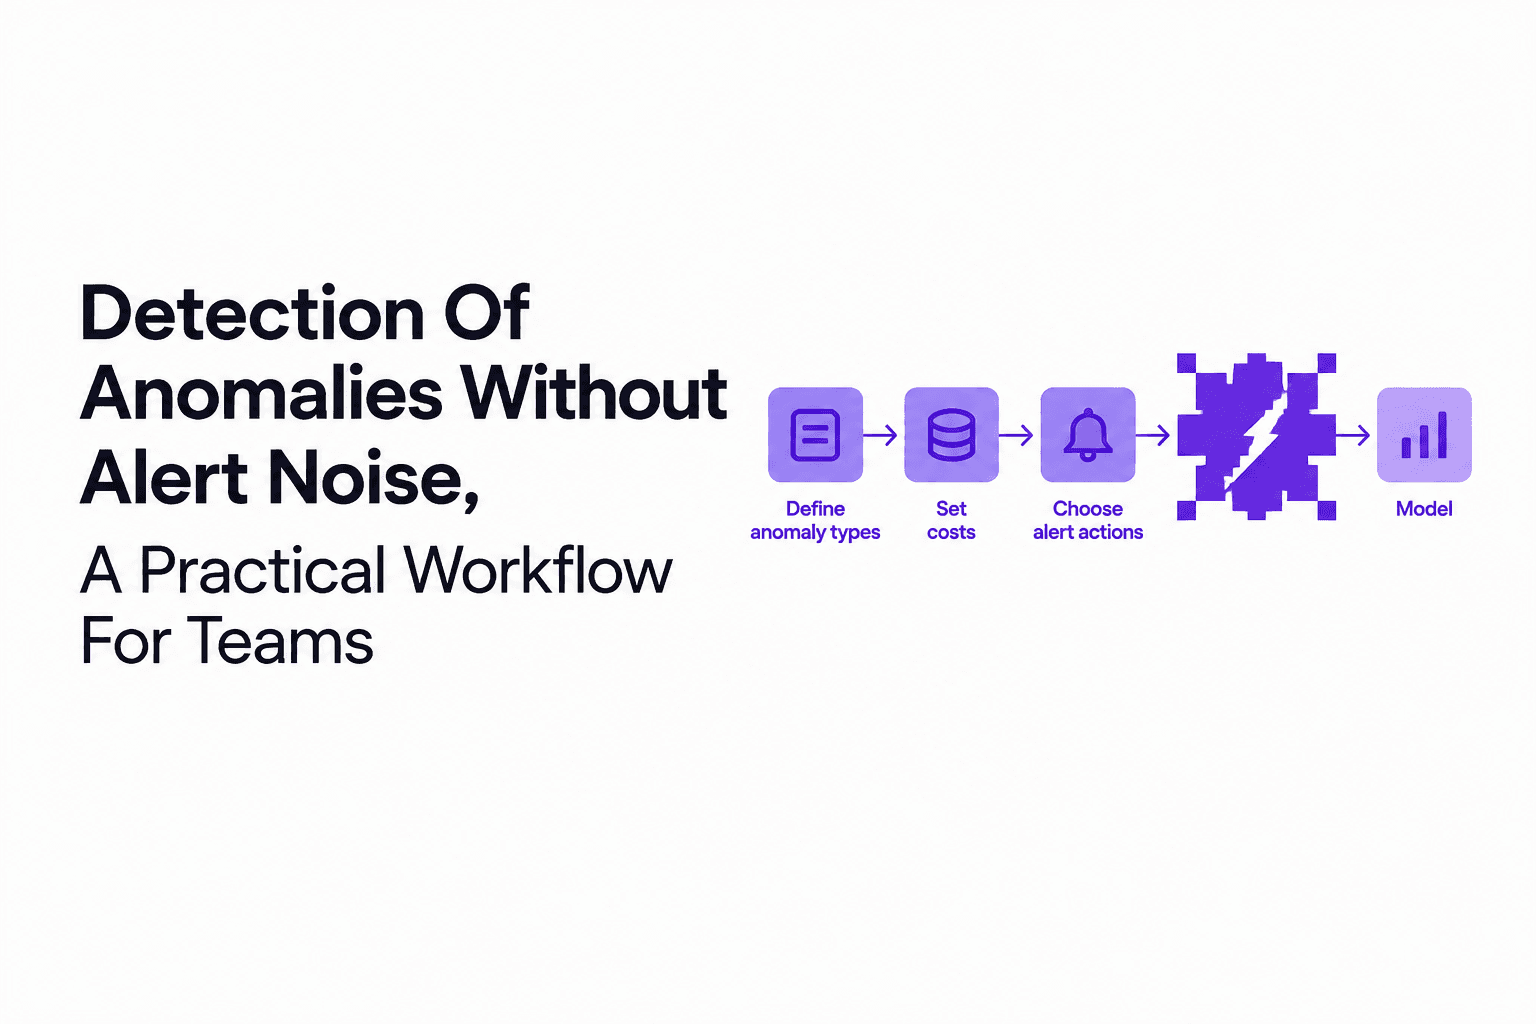
Detection Of Anomalies Without Alert Noise, A Practical Workflow For Teams
A practical workflow for detection of anomalies that reduces alert noise with cost-based thresholds, scarce-label validation, and ops-ready triage loops.

Stack Trace Explained, How To Read It And What To Collect When It’s Not Enough
Learn what a stack trace is, how to read it, and what context to collect when a stack trace isn’t enough to fix production bugs.

Software Bug Tracking System for Support Teams, A Practical Workflow for Catching Bugs Before Users Report Them
A software bug tracking system workflow for support teams: ticket fields, triage rules, AI capture signals, routing, and metrics to cut backlog.