
Log File Analyzer Workflow That Cuts Noise, A Practical Step-By-Step Guide
A log file analyzer is most useful when you treat it as a workflow for filtering, aggregating, and exporting decisions, not just a place to open a file and scroll. This guide shows how to separate “viewing” from “analyzing,” run a 15-minute walkthrough on a realistic access log snippet, and apply noise reduction techniques that keep rare incidents visible.
- Choose a log file analyzer based on the exact question you need answered (diagnosis, trend, correlation, or shareable evidence), not on how nicely it renders a file.
- Reduce noise without losing incidents by combining parsing, normalization, grouping, and targeted sampling, then validate with “did we still catch the outage?” checks.
- Use online analyzers for small, non-sensitive samples; switch to local or centralized analysis when file size, privacy, and collaboration become the bottleneck.
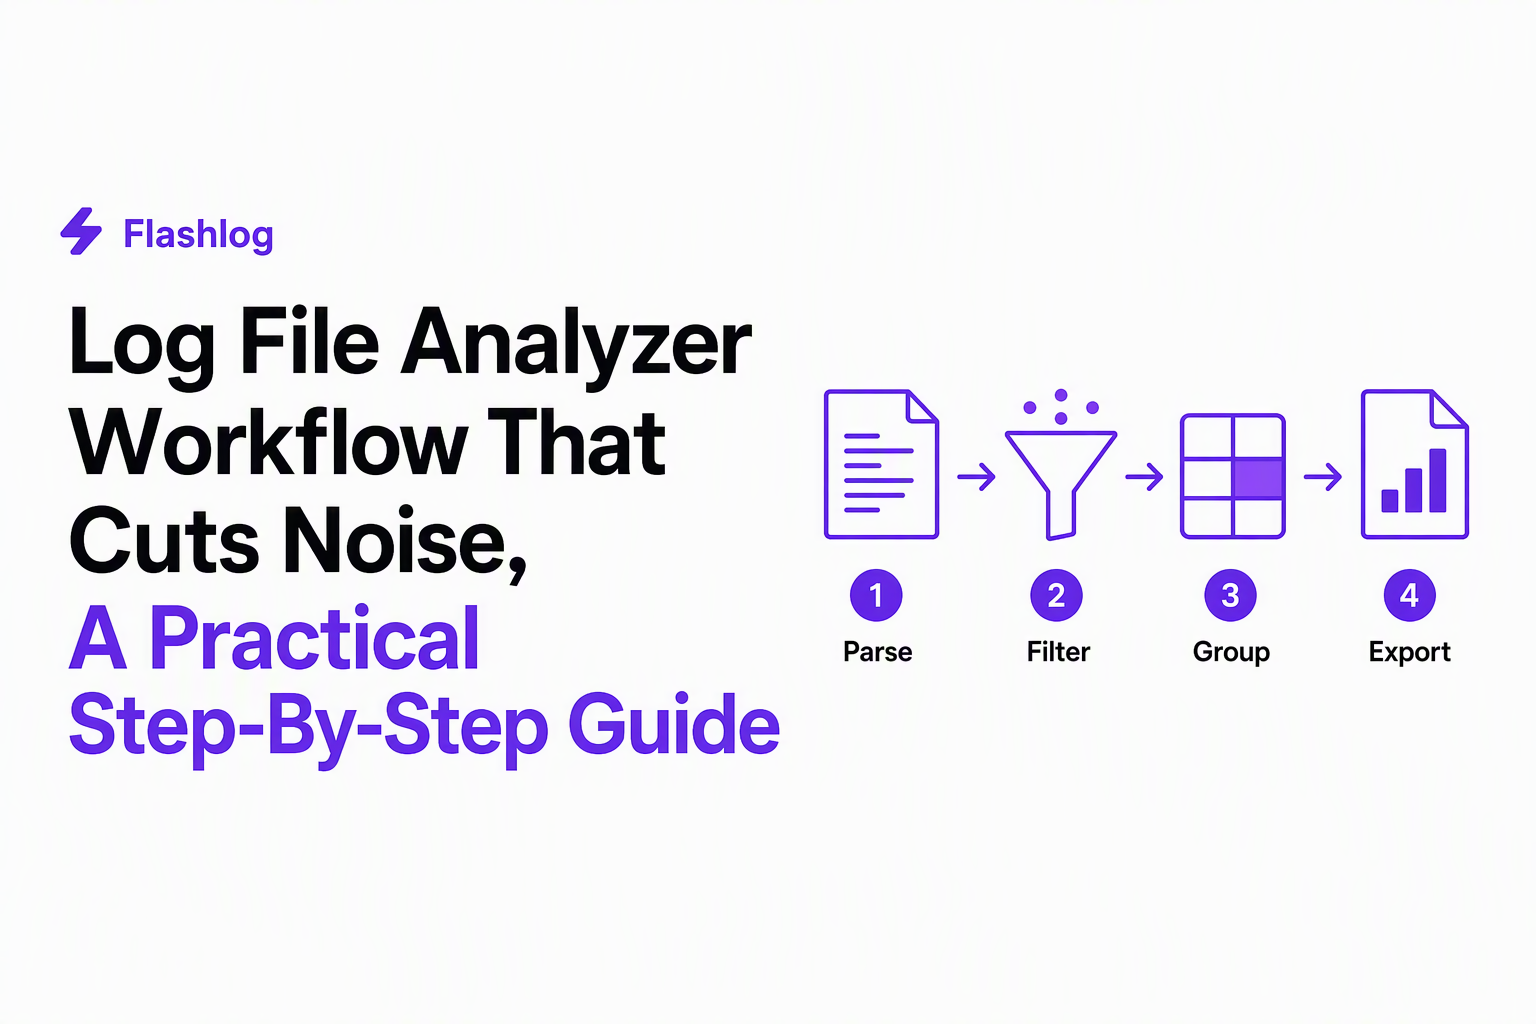
Viewer vs analyzer, choose the right tool before you start
A log viewer helps you read lines, while a log file analyzer helps you answer a question with repeatable filters, aggregations, and exports.
Define the job-to-be-done in one sentence
Before picking tools, write the question as an output you can hand to someone else. Here are common “good” questions a log file analyzer should make fast:
- Diagnosis: “Which requests are causing the 500s right now, and what do they have in common?”
- Quantification: “Did error rate change after deploy X, and by how much per endpoint?”
- Attribution: “Is the spike isolated to one region, one user agent, or one tenant?”
- Shareable evidence: “Can I export a small, reproducible slice that shows the issue?”
If the question is only “what does this line say?”, you need a viewer. If the question contains “how many”, “which”, “before/after”, or “group by”, you need analysis.
Map tool types to outcomes (avoid the wrong SERP intent)
Most teams lose time because they start with the wrong category. Use this mapping to choose quickly:
- Text editors and pagers (viewer): fast inspection (less, tail, VS Code) but weak for aggregation and repeatability.
- CLI pipelines (analyzer): grep, awk, sed, jq, plus purpose tools like GoAccess for web logs, great for quick counts and grouping.
- Centralized log platforms (analyzer): indexing + queries + dashboards; best when you need correlation and collaboration.
- Online analyzers (viewer + light analyzer): convenient for small samples; limited by file size and privacy constraints.
A 4-step selection framework that prevents rework
- Scope: single file vs many sources (app + nginx + DB).
- Latency: do you need answers in minutes (incident) or days (reporting)?
- Privacy: can the data leave your machine at all?
- Collaboration: does someone else need to reproduce your findings?
In our experience working with teams on incident response, the “collaboration” constraint is the one most often ignored until the first time someone asks, “Can you share the exact query and slice you used?”
A 15-minute log file analysis walkthrough using one realistic access log snippet
A practical log file analyzer workflow is “parse, filter, group, correlate, export” so the output is a decision-ready summary rather than a pile of lines.
Step 0: Start with a structured snippet you can paste into any tool
Assume a common NGINX access log format (combined + request time). Save as access.log:
203.0.113.9 - - [26/Sep/2026:10:01:02 +0000] "POST /api/checkout HTTP/1.1" 500 231 "-" "Mozilla/5.0" 0.842
203.0.113.9 - - [26/Sep/2026:10:01:03 +0000] "POST /api/checkout HTTP/1.1" 500 231 "-" "Mozilla/5.0" 0.901
198.51.100.22 - - [26/Sep/2026:10:01:04 +0000] "POST /api/checkout HTTP/1.1" 402 128 "-" "Mozilla/5.0" 0.210
192.0.2.44 - - [26/Sep/2026:10:01:05 +0000] "GET /img/optional-banner.png HTTP/1.1" 404 0 "-" "Mozilla/5.0" 0.015
203.0.113.77 - - [26/Sep/2026:10:01:06 +0000] "GET /api/orders HTTP/1.1" 200 912 "-" "Mozilla/5.0" 0.120
203.0.113.9 - - [26/Sep/2026:10:02:10 +0000] "POST /api/checkout HTTP/1.1" 500 231 "-" "Mozilla/5.0" 0.880
This is intentionally mixed: real server errors (500), an expected business outcome (402 payment required style behavior, often a declined payment), and harmless 404 noise.
Step 1: Parse into fields (so you can group)
If you can’t parse, you can’t analyze. Two fast options:
- GoAccess for web access logs (quick dashboards). Install instructions: GoAccess.
- CLI parse with awk when you only need a few fields.
For a fast, reproducible parse without standing up a system, extract method, path, status, and request time:
awk '{
  # request is in quotes: "METHOD PATH HTTP/x"
  match($0, /"(GET|POST|PUT|DELETE|PATCH) ([^ ]+) [^"]+" ([0-9]{3}) [0-9]+ "[^"]*" "[^"]*" ([0-9.]+)/, a);
  if (a[1] != "") print a[1]"\t"a[2]"\t"a[3]"\t"a[4];
}' access.log > parsed.tsv
Step 2: Filter to what is actionable (define “noise” explicitly)
A log file analyzer reduces noise best when you formalize exclusions as rules rather than relying on memory. Start with two categories:
- Expected business responses: endpoints that commonly return non-200 by design (auth failures, validation, payment declines).
- Harmless asset misses: known optional images, bots probing, favicon 404s, etc.
Filter to server errors first:
awk -F'\t' '$3 >= 500 {print}' parsed.tsvNow you have the slice that tends to map to engineering work.
Step 3: Aggregate into “one issue”, not 200 lines
Grouping is where analysis beats viewing. Count errors by endpoint:
awk -F'\t' '{key=$1" "$2" "$3; c[key]++} END {for (k in c) print c[k]"\t"k}' parsed.tsv | sort -nrIn this snippet, POST /api/checkout 500 becomes the dominant group. That is your first “issue fingerprint”: method + path + status.
Step 4: Preserve high-impact outliers with a latency cut
Noise reduction fails when it also discards the rare slow request that signals a partial outage. Add a threshold on request time (example: > 0.8s) and cross-check what it catches:
awk -F'\t' '$4 > 0.8 {print}' parsed.tsvWhat surprised our team was how often “slow but 200” requests were the earliest indicator during degraded dependencies, so we keep a latency slice even when hunting errors.
Step 5: Export a shareable artifact
For handoff, export two things: (1) the grouped summary, (2) a small sample of representative lines for the top group.
# summary
awk -F'\t' '{key=$1" "$2" "$3; c[key]++} END {for (k in c) print c[k]","k}' parsed.tsv | sort -t',' -nr > summary.csv

# sample the top fingerprint
grep -F "POST\t/api/checkout\t500" parsed.tsv | head -n 20 > checkout-500-sample.tsv
The goal is reproducibility: another engineer should be able to re-run the same steps and get the same grouping.
Online log file analyzer options, when free in-browser tools work and when they don’t
Online log file analyzer tools are sufficient when you are analyzing a small, non-sensitive excerpt and you need quick parsing or visualization without setup.
A decision checklist for using online tools safely
- File size: keep it to a small sample (think kilobytes to a few megabytes) instead of full production dumps.
- Data classification: avoid anything that may contain tokens, emails, IPs you treat as personal data, or internal URLs.
- Goal clarity: use online tools for formatting, quick counts, or charting, not for deep correlation across systems.
- Shareability: online tools can be great when you need a linkable view, but only if the data is safe to share.
Common failure modes (and what to switch to)
- Upload limits or browser freezes: switch to local CLI analysis or a desktop viewer.
- Privacy uncertainty: switch to offline tools and redact before sharing.
- Need cross-file correlation: switch to a centralized system or at least a structured pipeline that merges sources.
When you hit those limits, it’s rarely about “a better UI” and usually about needing indexing, queries, and saved filters. If you want a deeper workflow for that transition, see our guide on log analyzer setups that move from ad hoc to repeatable.
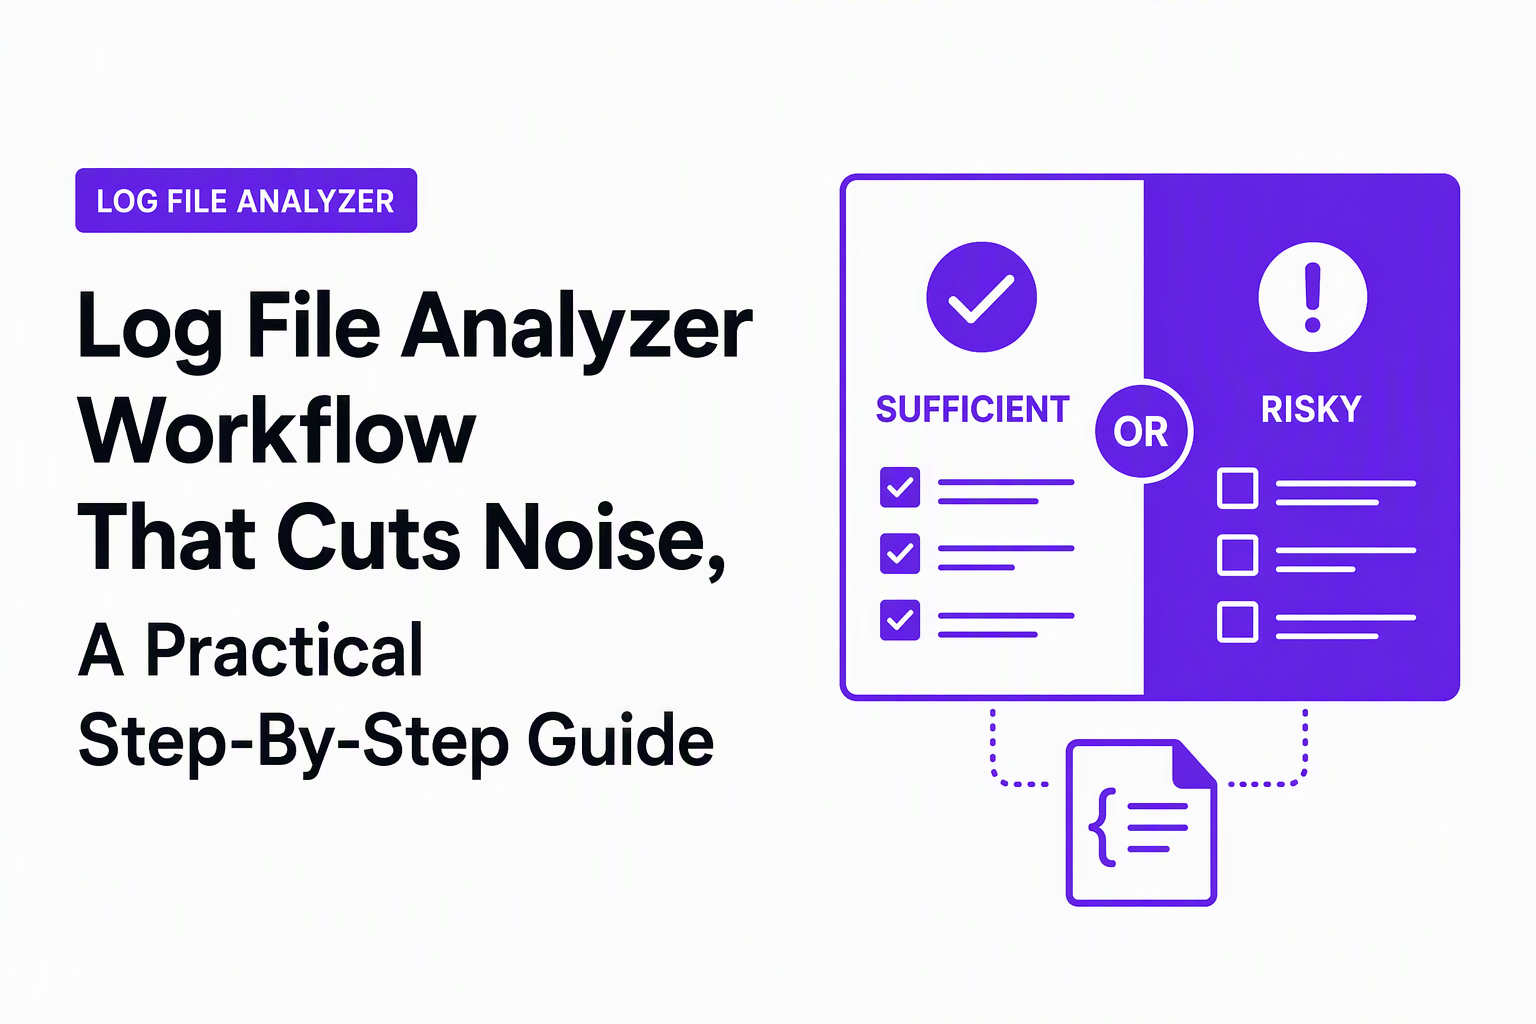
Noise reduction in log analysis, parsing, sampling, and correlation that preserve incidents
Noise reduction works when you remove repetitive non-actionable patterns while explicitly protecting rare, high-impact signals with guardrail queries.
Use a “noise taxonomy” so filtering stays consistent
Instead of deleting “annoying” logs, classify them into buckets you can defend:
- Expected failures: validation errors, permission denials, rate limits, payment declines.
- Duplicate storms: same stack trace or same endpoint failing across many users.
- Low-context events: single-line errors without identifiers or user impact context.
- Benign 404s and bot traffic: missing optional assets, scanners, health checks.
This is where “viewing” becomes “analyzing”: you turn judgment calls into rules, fingerprints, and saved queries.
Apply three techniques in order (so you don’t hide incidents)
- Normalize: remove high-cardinality fields before grouping (request IDs, timestamps, random tokens). In JSON logs, drop or mask fields like
request_idwhen counting duplicates. - Fingerprint: group by stable dimensions (service, endpoint, status, error type). For web logs, method + path template + status is a good start.
- Guardrails: keep separate queries for “rare but severe” patterns (new 500s, p95 latency jumps, new endpoints generating errors).
Sampling that doesn’t destroy the one line you needed
Random sampling is risky for incidents because it can drop rare errors. Prefer one of these:
- Stratified sampling by fingerprint: keep N examples per fingerprint, not N lines overall.
- Head + tail sampling during spikes: keep the first 50 and last 50 occurrences to capture onset and recovery clues.
- Deterministic sampling: hash on a stable field (like user_id) so repeated analysis is consistent.
After running multiple on-call retros, the pattern was clear: the fastest teams didn’t read more logs, they read fewer but better-grouped logs and always retained a small example set per group.
Correlation: connect access logs to app errors without a huge platform
You can do “good enough” log correlation with a shared identifier and a join-like workflow:
- Propagate a request ID: include
X-Request-Idin edge logs and application logs. - Extract the ID into a file: grep access logs for failing requests, pull request IDs, then grep app logs for the same IDs.
- Time-window correlation: if you lack IDs, correlate by a tight time window plus endpoint and user/tenant.
If you want a dedicated framework for this step, the practical patterns in log correlation are the next increment once grouping is working.
AI for log files, what it actually automates and how to evaluate it
AI helps most when it automates clustering, deduplication, and context-based classification so engineers see fewer, higher-confidence issues instead of raw event volume.
What AI can do well (and what it should not replace)
- Good at: grouping similar error messages that differ in small ways, summarizing long multi-line exceptions, suggesting likely root-cause categories.
- Good at: routing and prioritization when you provide guardrails (service ownership, severity rules, deployment metadata).
- Not a replacement for: source-of-truth metrics, reproducible queries, or clear incident definitions.
Mini playbook: evaluate AI output like an on-call would
Use a simple scorecard that you can run on a week of incidents:
- Precision: of the issues it surfaced, how many were truly actionable?
- Deduplication quality: did it merge the 200 duplicates into one thread without mixing unrelated causes?
- Explainability: can it state why something was classified as expected vs bug?
- Latency: how quickly it turns raw events into a grouped issue you can act on.
When we tested AI clustering against manual grep-based grouping, the biggest win was not “finding new errors”, it was cutting repeated investigations by making the grouping and the reason for grouping explicit.
Where AI fits once manual analysis hits scale limits
Manual log file analyzer workflows break down when (1) duplicates create alert fatigue, (2) expected failures flood the backlog, and (3) low-context events waste triage time. An AI layer is most credible when it sits behind deterministic rules, then adds probabilistic classification with a confidence gate.
For a related workflow on keeping analysis actionable under pressure, see issue triage and the operational guardrails in debug in production.
How to select a log file analyzer for your team, a practical scorecard
A log file analyzer selection becomes straightforward when you score tools against parsing, grouping, correlation, and safe sharing instead of UI preferences.
A lightweight scoring rubric (0 to 2) you can use in 20 minutes
- Parsing (0-2): handles your formats (JSON, nginx, multiline stack traces) with low effort.
- Querying (0-2): filter and group by fields, not just regex on text.
- Deduplication (0-2): supports fingerprints, grouping, and occurrence counts.
- Correlation (0-2): joins by request_id/trace_id or supports time-window correlation.
- Exports (0-2): can export query + result + sample lines for handoff.
- Security (0-2): supports redaction, access controls, and offline operation when needed.
- Operational fit (0-2): integrates with where work happens (tickets, chat, weekly review).
What “good enough” looks like by team stage
- Early stage: local CLI + a repeatable script that outputs CSV summaries and samples.
- Growing: saved queries, shared dashboards, and correlation across services.
- At scale: strong dedupe, automated routing, and noise gates so only actionable issues page humans.
A quick rule for switching categories
Switch from ad hoc analysis to a more capable log file analyzer setup when at least one of these becomes weekly pain:
- You regularly analyze more than one file/source per incident.
- You can’t reproduce last week’s answer because filters weren’t saved.
- The same error creates dozens of alerts or tickets without grouping.
- Privacy constraints prevent using online tools, but you still need shareable slices.
If you’re standardizing a repeatable practice across teams, the workflow patterns in log analysis can help you document “how we do it here” without turning it into a tool war.
| Need | Best starting tool type | Why it works | Common upgrade trigger |
|---|---|---|---|
| Quick read of a single file | Viewer (less, VS Code) | Fast open, search, copy snippets | Need grouping, counts, exports |
| Counts by endpoint/status in minutes | CLI analyzer (awk/grep, GoAccess) | Repeatable commands, easy CSV output | Multiple sources, saved queries needed |
| Correlation across services | Centralized analyzer (indexed queries) | Fast search across time and systems | Alert fatigue, duplicate storms |
| Reduce noisy issues before tickets/alerts | Noise gate (rules + classification) | Filters expected failures, groups duplicates | Engineers ignore alerts or backlog inflates |
FAQ
If your log file analyzer workflow is working but you still lose time to duplicated events, expected business errors, or low-confidence signals that turn into noisy tickets, Flash Log is a practical next-step to pilot: it captures bugs automatically even when users never report them, classifies events with an AI confidence gate, and groups repeats into a single actionable issue so engineering effort goes into fixes, not interruptions.
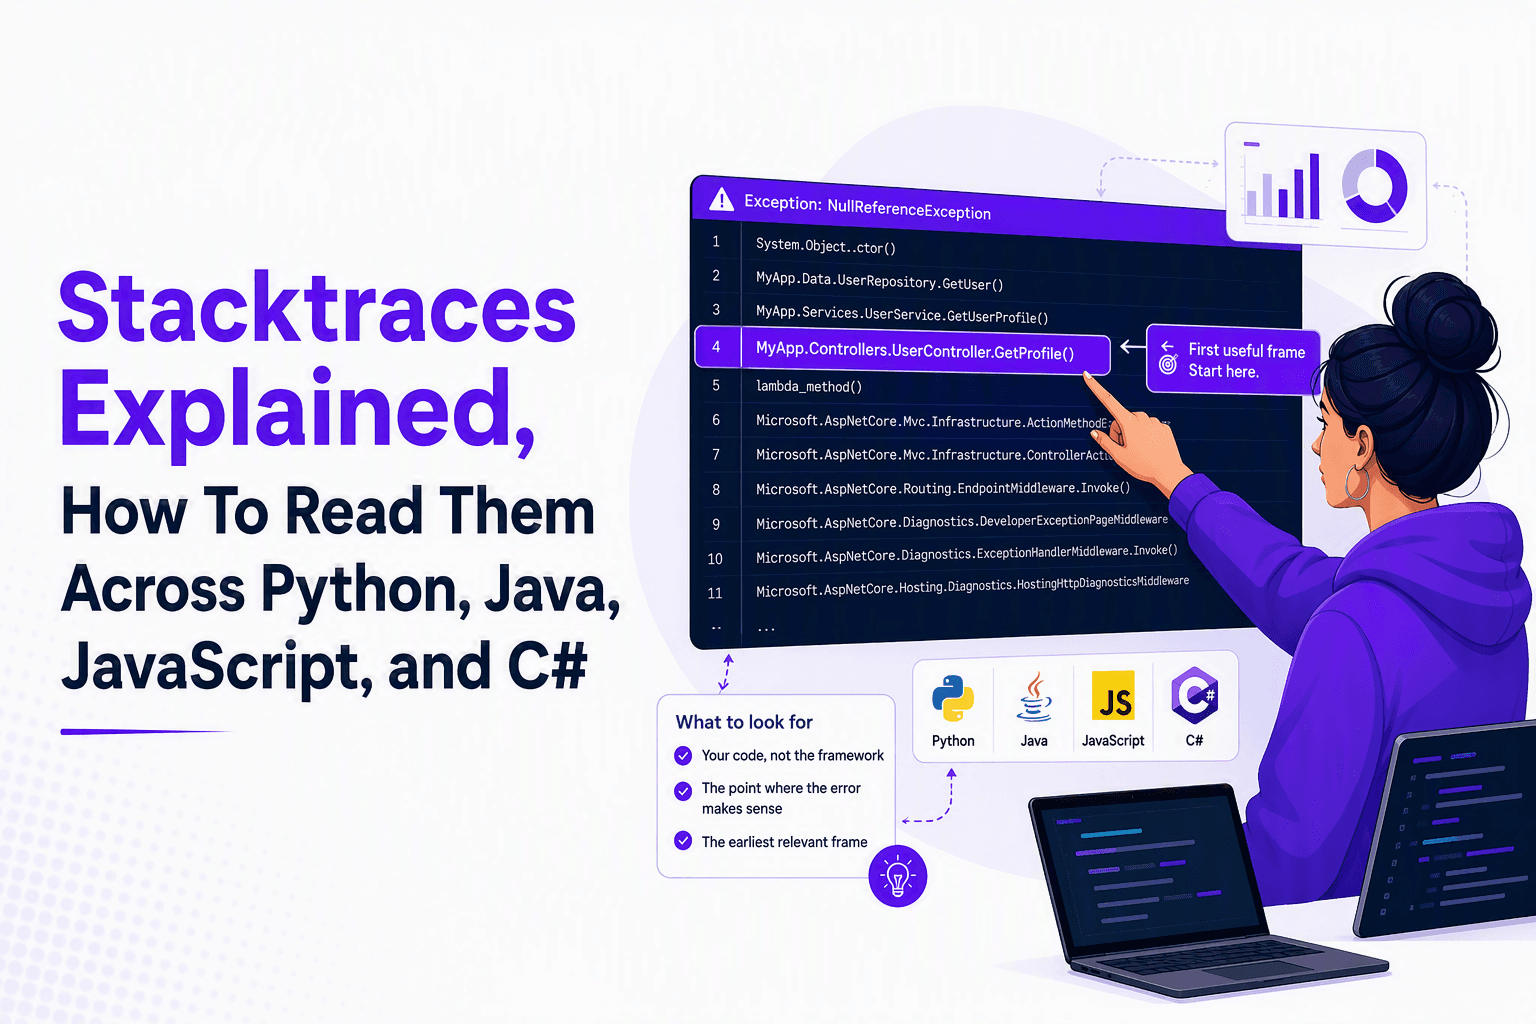
Stacktraces Explained, How To Read Them Across Python, Java, JavaScript, and C#
Learn how to read stacktraces fast: find the useful frame, reduce noise, handle missing symbols, and share redacted traces safely.

How Session Replay Works, The End-to-End Pipeline From Capture to Playback
Learn how session replay works end to end: capture, serialize, transmit, store, and reconstruct, plus Android specifics, performance, and privacy.
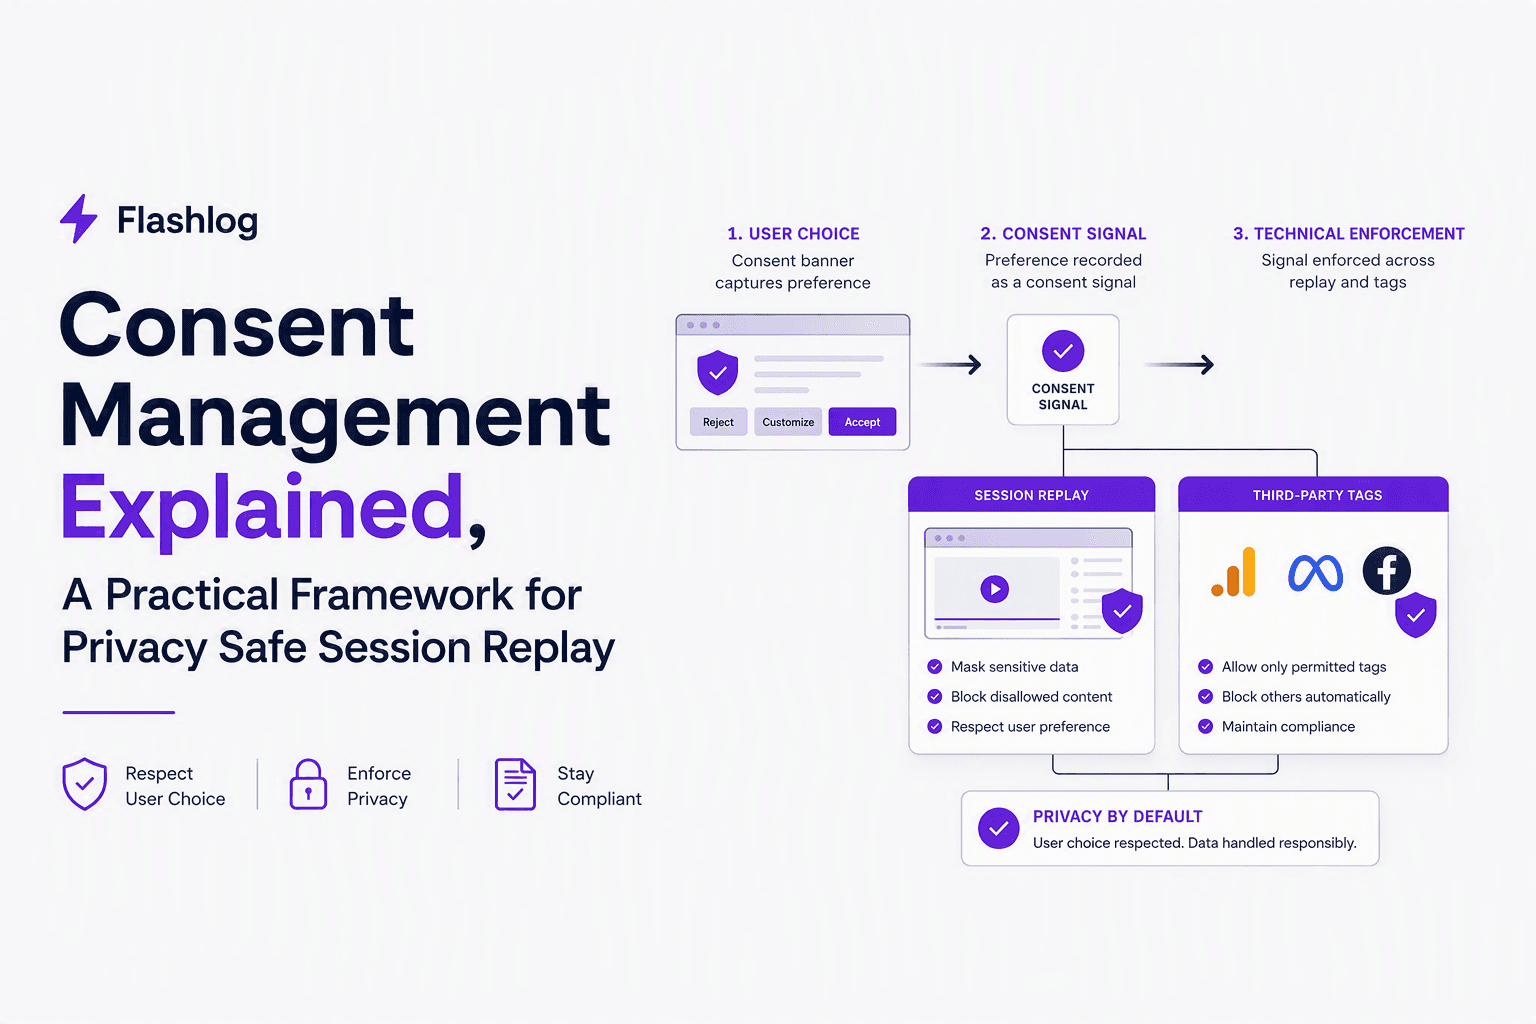
Consent Management Explained, A Practical Framework for Privacy Safe Session Replay
Learn consent management for session replay: laws, lifecycle architecture, examples, and standards (TCF, GPP, GPC, Consent Mode) with checklists.