
Log Analysis Without the Noise, A Practical Workflow With Real Log Examples
Log analysis works best when you treat every step as a noise-reduction checkpoint, so raw high-volume events turn into a small set of trustworthy signals instead of endless alerts.
- Put noise gates before alerting: normalize fields, dedupe, suppress expected failures, and only then route to tickets and paging.
- Use a repeatable workflow with measurable quality checks (parse success, field coverage, dedupe rate, and alert precision) to prevent “log storms.”
- Use AI selectively: clustering and confidence gating help, but only with deterministic backstops, sampling, and audit trails.
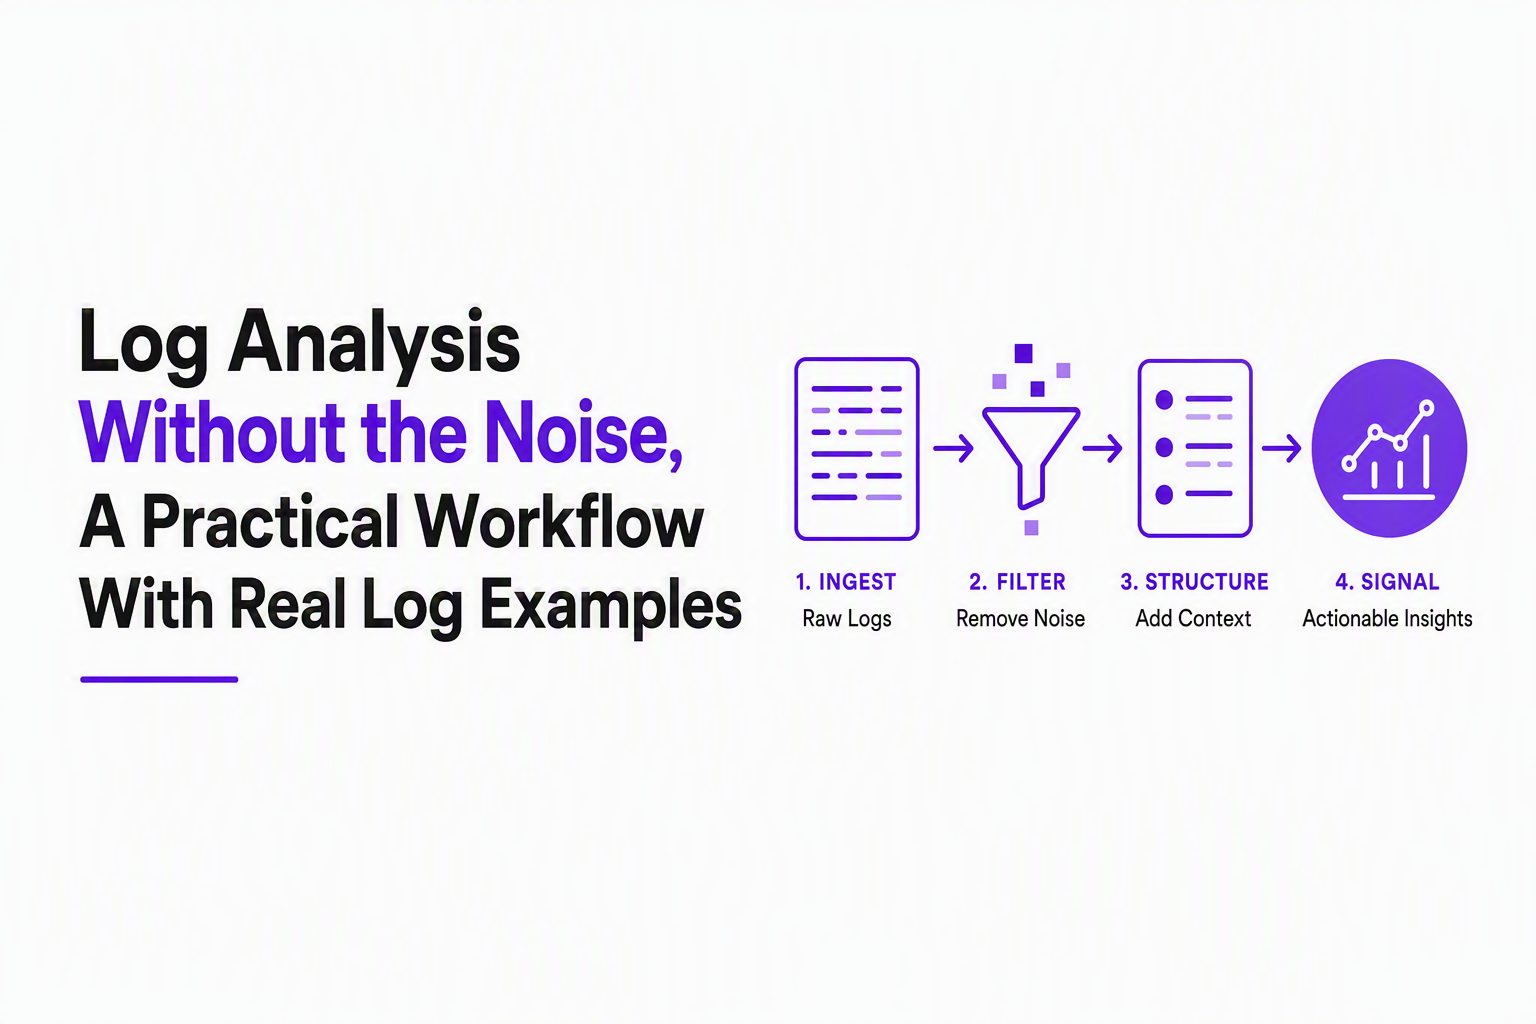
The log analysis workflow that prevents noise from becoming alerts
A reliable workflow for log analysis puts explicit “noise gates” between collection and notification so expected failures and duplicates never reach humans by default.
Checkpoint map from raw events to actionable issues
Most teams already have collection, parsing, and dashboards. The failure mode is missing checkpoints that turn volume into signal. Use this map and treat each step as something you can verify weekly:
- Collect: ingest from NGINX, app JSON logs, platform logs, and traces. Noise checkpoint: drop obviously irrelevant sources early (health checks, static assets) at the edge when possible.
- Parse and normalize: extract stable fields (service, env, status, path template, request_id, user_id, error_class). Noise checkpoint: enforce parse success and tag failures.
- Enrich: add deployment version, region, host, and ownership (team/service). Noise checkpoint: ensure every alertable event has an owner field.
- Index and retain: store raw, plus a curated “analytics” stream with normalized fields. Noise checkpoint: limit cardinality blowups (for example, raw URL with IDs) in the analytics stream.
- Analyze and aggregate: compute rates, error budgets, unique users impacted, and dedup fingerprints. Noise checkpoint: aggregate before you alert.
- Monitor and notify: route to Slack, tickets, paging only after suppression and confidence checks. Noise checkpoint: require an “actionability” label.
A simple, enforceable noise gate checklist
In our experience, the fastest way to reduce alert fatigue is to enforce a small set of rules that every alert must satisfy:
- Parsed: required fields exist (timestamp, service, env, status or level, endpoint or message template).
- Grouped: alert represents a group (fingerprint) with a count, not a single line.
- Scoped: alert includes affected endpoint, release version, and at least one impact proxy (unique users, % of requests, or revenue path flag).
- Not expected: matched against an allowlist of “expected business errors” (declined payments, validation errors, permission denials) that should not page by default.
- Owned: has an explicit service owner and routing target.
Where noise sneaks in (and how to stop it)
The usual culprits are predictable and fixable:
- High-cardinality fields like raw URL paths, query strings, and exception messages with IDs. Fix by logging both raw and templated forms, then alert on the template.
- Duplicate event storms where one frontend crash produces hundreds of identical server errors. Fix by fingerprinting and grouping.
- Expected failures (403, 404 for optional assets, “payment declined”). Fix by suppression rules tied to endpoint and flow, not global status codes.
- Low-confidence signals from heuristics or AI that produce plausible but wrong “bugs.” Fix with confidence gating plus sampling and review.
Hands-on log analysis example from raw lines to findings you can act on
Hands-on log analysis should end with a short list of grouped issues with counts, impact, and the smallest query that reproduces the pattern.
Sample logs (NGINX + JSON app logs)
Assume you have two files on a box or in an export: nginx_access.log and app.jsonl. Here are realistic lines:
2026-09-18T10:01:22Z api-1 nginx: 203.0.113.10 - - "POST /api/checkout HTTP/1.1" 500 612 "-" "Mozilla/5.0" req_id=8f1a
2026-09-18T10:01:24Z api-2 nginx: 198.51.100.7 - - "POST /api/checkout HTTP/1.1" 402 188 "-" "Mozilla/5.0" req_id=8f1b
2026-09-18T10:01:27Z api-1 nginx: 203.0.113.10 - - "GET /cdn/img/optional.png HTTP/1.1" 404 153 "-" "Mozilla/5.0" req_id=8f1c
{"ts":"2026-09-18T10:01:22.410Z","service":"checkout","env":"prod","level":"error","msg":"Unhandled exception","path":"/api/checkout","status":500,"req_id":"8f1a","error_class":"NullReference","stack":"at submitOrder (checkout.js:413)"}
{"ts":"2026-09-18T10:01:24.102Z","service":"checkout","env":"prod","level":"info","msg":"Payment declined","path":"/api/checkout","status":402,"req_id":"8f1b","decline_code":"card_issuer"}
{"ts":"2026-09-18T10:01:27.901Z","service":"web","env":"prod","level":"warn","msg":"Asset not found","path":"/cdn/img/optional.png","status":404,"req_id":"8f1c"}
Step 1: quantify what is actually “noisy”
Start by getting a fast breakdown of status codes and endpoints. If you only do one thing, do it as a grouped count.
# NGINX: top endpoints by non-2xx
awk 'match($0, /"(GET|POST) ([^ ]+)/, a) {method=a[1]; path=a[2]} match($0, /" [0-9]{3} /) { } {print method" "path" "$(NF-5)}' nginx_access.log 2>/dev/null \
  | awk '$3 !~ /^2/ {print $1" "$2" "$3}' \
  | sort | uniq -c | sort -nr | head
If your format differs, the principle is the same: count by (method, normalized path, status) before you look at individual lines.
Step 2: separate expected failures from actionable failures
Now classify the obvious “expected” flows using explicit rules. For example, treat 402 Payment declined and optional CDN 404s as non-actionable unless they spike above a business threshold.
# App logs: count error_class and status for checkout
jq -r 'select(.service=="checkout") | [.status, (.error_class//"-") , .msg] | @tsv' app.jsonl \
  | sort | uniq -c | sort -nr
Interpretation for this dataset:
- 402 Payment declined: expected business response; track rate for fraud/checkout funnel health, but do not create engineering incidents by default.
- 404 optional CDN asset: expected in many apps; ignore by path pattern.
- 500 with NullReference: actionable; group and escalate.
Step 3: dedupe into one issue fingerprint
For actionable errors, dedupe by a stable fingerprint. A practical fingerprint often uses (service, endpoint template, error_class, top stack frame).
# Extract a simple fingerprint from JSON logs
jq -r 'select(.level=="error") |
  .service + "|" + .path + "|" + (.error_class//"-") + "|" +
  ((.stack//"-") | split("\n")[0])' app.jsonl \
  | sort | uniq -c | sort -nr | head
Output like “238 occurrences of checkout|/api/checkout|NullReference|at submitOrder (checkout.js:413)” is already more actionable than 238 separate alerts.
Step 4: add an impact proxy before you page anyone
Before routing, add at least one impact proxy: unique users, percentage of requests, or whether the endpoint is revenue-critical. If you do not have user IDs, request rate can still be a proxy.
# NGINX: error rate for /api/checkout (rough proxy)
grep 'POST /api/checkout' nginx_access.log | awk '{print $(NF-5)}' | \
  awk '{count[$1]++} END {for (s in count) print s, count[s]}' | sort -nr
In our experience, paging on “count only” creates false urgency. Paging on “count plus impact proxy” dramatically improves trust, even if the proxy is imperfect at first.
Equivalent view in a log tool query
If your logs are parsed into fields (for example in Elastic, Loki with extracted labels, or a managed log platform), the query you want is still an aggregate and group-by, not a raw search:
- Filter:
env=prod AND service=checkout - Exclude expected:
status=402 OR path matches /cdn/img/*(send these to a dashboard, not paging) - Group: by
path,error_class, and first stack frame - Compute: occurrences per 5 minutes, plus unique req_id or user_id if present
AI noise reduction techniques for logs that actually work in production
AI noise reduction in log analysis works when it is constrained to grouping and classification tasks with confidence gates and auditable fallbacks, not when it replaces your rules.
Technique 1: clustering and fingerprint suggestions (with human-verifiable keys)
Use AI to propose clusters, then force each cluster to emit a deterministic key you can test. For example, AI can suggest that these messages are the same class of bug, but you still store and alert on a fingerprint like:
service + endpoint_template + error_class + top_stack_frameservice + db_error_codefor database failures
Guardrail: any cluster without a stable key stays in “review” instead of paging.
Technique 2: anomaly scoring on rates (not on raw messages)
Anomaly detection is safer when it runs on aggregated metrics, not individual log lines. Compute rates first, then score changes in:
- 500 rate per endpoint per 5 minutes
- authentication failures per IP per 10 minutes
- latency percentiles (if you log durations)
Guardrail: require a minimum volume threshold so low traffic endpoints do not trigger noise from random variance.
Technique 3: suppression rules powered by context
Rules are still the backbone for expected failures. AI can help decide when a rule should apply by reading context, but the output should be “ignored because matched rule X” or “muted because expected business response,” not an unexplained label.
- Ignore known harmless routes and statuses (for example, optional CDN 404s).
- Mute payment declines and validation failures by default, then alert only on spikes tied to business thresholds.
- Suppress duplicate events by grouping occurrences under one fingerprint with a live count.
Technique 4: confidence gating with sampling and audits
Confidence gates reduce false positives only if you also review what got held back. A practical workflow:
- Route high-confidence “real bug” groups to ticketing or Slack.
- Hold low-confidence groups in a review queue.
- Sample a fixed number daily (for example, 20 groups) to estimate the false negative risk.
What surprised our team was how often “low confidence” buckets contained parsing problems rather than genuinely ambiguous incidents, which meant the fix was better normalization, not a better model.
Measurable standards for good log analysis and low-noise alerting
Measurable standards make log analysis trustworthy because they define what “good” looks like in parsing quality, grouping quality, and alert precision.
Quality metrics you can track without inventing KPIs
You do not need perfect observability maturity to measure noise. Start with metrics you can compute from your pipeline:
- Parse success rate: % of ingested lines that map to the expected schema. Target: trend upward; alert if it drops sharply after a deploy.
- Field coverage: % of events with required fields like service, env, status/level, endpoint template.
- Dedupe rate: (raw events) divided by (grouped issues). If the ratio collapses, you are either losing grouping keys or experiencing a real incident storm.
- Alert precision (operational): % of alerts that resulted in an engineering action (fix, rollback, mitigation). If engineers repeatedly close alerts as “expected,” your rules are wrong.
Threshold tuning rules that reduce noise safely
Use thresholding rules that are easy to explain and adjust:
- Minimum occurrences: do not alert until a fingerprint appears N times in M minutes, unless it is a known critical endpoint.
- Minimum impact: do not page unless unique users or request percentage crosses a threshold.
- Change-based alerts: alert on a sudden increase from baseline rather than absolute counts for high-variance endpoints.
Retention and sampling standards (practical, not dogmatic)
Retention depends on your regulatory needs and storage constraints, but the standard should be explicit:
- Raw logs: shorter retention if cost is high, but enough to investigate recent incidents and regressions.
- Curated aggregates: longer retention for trend analysis because they are cheaper and lower-cardinality.
- Audit samples: keep a sample of suppressed and low-confidence events so you can prove the noise gate is not hiding real incidents.
Security, DevOps, and compliance use cases with investigation playbooks
Operational playbooks turn log analysis into repeatable investigations by defining the minimum queries, grouping keys, and decision criteria for each scenario.
Playbook 1: brute force or credential stuffing
Goal: detect repeated auth failures from the same IP or ASN with a clear threshold and a suppression plan for known scanners.
- Group by: IP, username/email hash (never raw), endpoint.
- Signal: rising 401/403 rate plus many unique usernames per IP.
# Example from NGINX access logs (rough)
grep '/login' nginx_access.log | grep '" 401 ' | \
  awk '{print $1" "$2" "$3" "$4" "$5" "$6}' \
  | sort | uniq -c | sort -nr | head
Decision criteria: page security only when failures exceed a threshold and are not on your known scanner list.
Playbook 2: traffic spike or bot amplification
Goal: determine whether the spike is real users, bots, or a retry storm from a broken client.
- Group by: endpoint template, user agent family, status code.
- Check: cache hit rates (if logged), upstream latency, and 429/503 increases.
External standard for rate-limiting semantics: RFC 6585 defines 429 Too Many Requests, which is useful when you decide what is “expected throttling” versus an incident.
Playbook 3: crash loop or new 500s after deployment
Goal: catch new exception fingerprints and correlate them to a release or config change.
- Group by: service, release version, error_class, top stack frame.
- Decision: new fingerprint appearing after deployment is higher priority than a long-known noisy one.
For deeper debugging, connect this with debug in production practices so engineers can validate fixes safely.
Playbook 4: database errors and timeouts
Goal: distinguish query timeouts, connection pool exhaustion, and constraint violations so you route to the right owner.
- Group by: db_error_code, query name (not raw SQL), service, region.
- Suppression: ignore known constraint violations if they are user-driven and handled, but alert on spikes or on unhandled exceptions.
When investigating application exceptions, having readable stacktraces and a stable fingerprint policy is what keeps incident response calm.
Compliance logging needs (GDPR/PCI-style) without over-logging
Compliance requirements vary, so avoid guessing specifics; the workable standard is to log security-relevant events with minimal personal data and clear retention.
- Do log: authentication events, permission changes, admin actions, payment workflow state changes (without sensitive payloads).
- Do not log: raw credentials, full card data, or unnecessary PII.
- Prove: who did what, when, and from where using stable identifiers and hashes.
Choosing a log analysis stack without getting locked into vendor marketing
A good log analysis stack choice comes down to parsing reliability, query ergonomics, cost control, and how well it supports grouping and suppression.
Selection criteria that map to noise reduction
- Parsing and schema support: Can you enforce required fields and flag parse failures?
- Aggregation-first workflows: Are group-by queries fast and easy to share?
- Cardinality controls: Can you limit or reroute high-cardinality fields to cheaper storage?
- Alert routing after filtering: Can alerts depend on grouped counts and suppression rules, not raw matches?
- Access and audit: Can you review suppressed events and changes to rules?
Neutral guidance across common options
Different stacks can work, but you should evaluate them using the same “noise gate” requirements:
- Elastic / OpenSearch: strong search and aggregation; watch indexing and mapping discipline to avoid cardinality issues.
- Grafana Loki: great for label-based querying; invest early in label strategy so you do not encode cardinality into labels.
- Cloud-native: easy ingestion; make sure you can extract fields and build grouped alerts rather than string-match alerts.
- Self-hosted options: control and cost predictability, but you own scaling and retention tradeoffs.
After running multiple “log migrations,” the pattern was clear: the tool matters less than whether the team commits to normalized fields, fingerprints, and suppression rules as first-class artifacts.
If you want a repeatable investigation loop, pair log search with log correlation so grouped issues can be traced across services. For operational handoffs, a lightweight issue triage routine keeps the backlog from turning into a second alert channel.
| Noise-control requirement | What “good” looks like | How to test in a trial |
|---|---|---|
| Grouping and dedupe | One issue per fingerprint with occurrence count | Replay a known incident log set and compare raw events vs grouped issues |
| Suppression rules | Explicit ignore rules by endpoint/status/flow | Mute payment declines and optional 404s, then verify nothing pages |
| Parse quality | Required fields present; parse failures visible | Introduce a format change and ensure parse failures are detectable |
| Alert actionability | Alerts include owner, impact proxy, and link to query | Ask on-call to resolve from the alert alone, without hunting |
| Auditability | Ability to review suppressed/low-confidence events | Sample suppressed groups daily and measure false negative risk |
FAQ
If you want to pilot an AI-assisted workflow that auto-captures production bugs even when users never report them, and classifies events so duplicates and expected failures do not become noisy tickets, Flash Log can sit alongside your existing log stack as a practical “decision layer” for cleaner engineering handoffs.
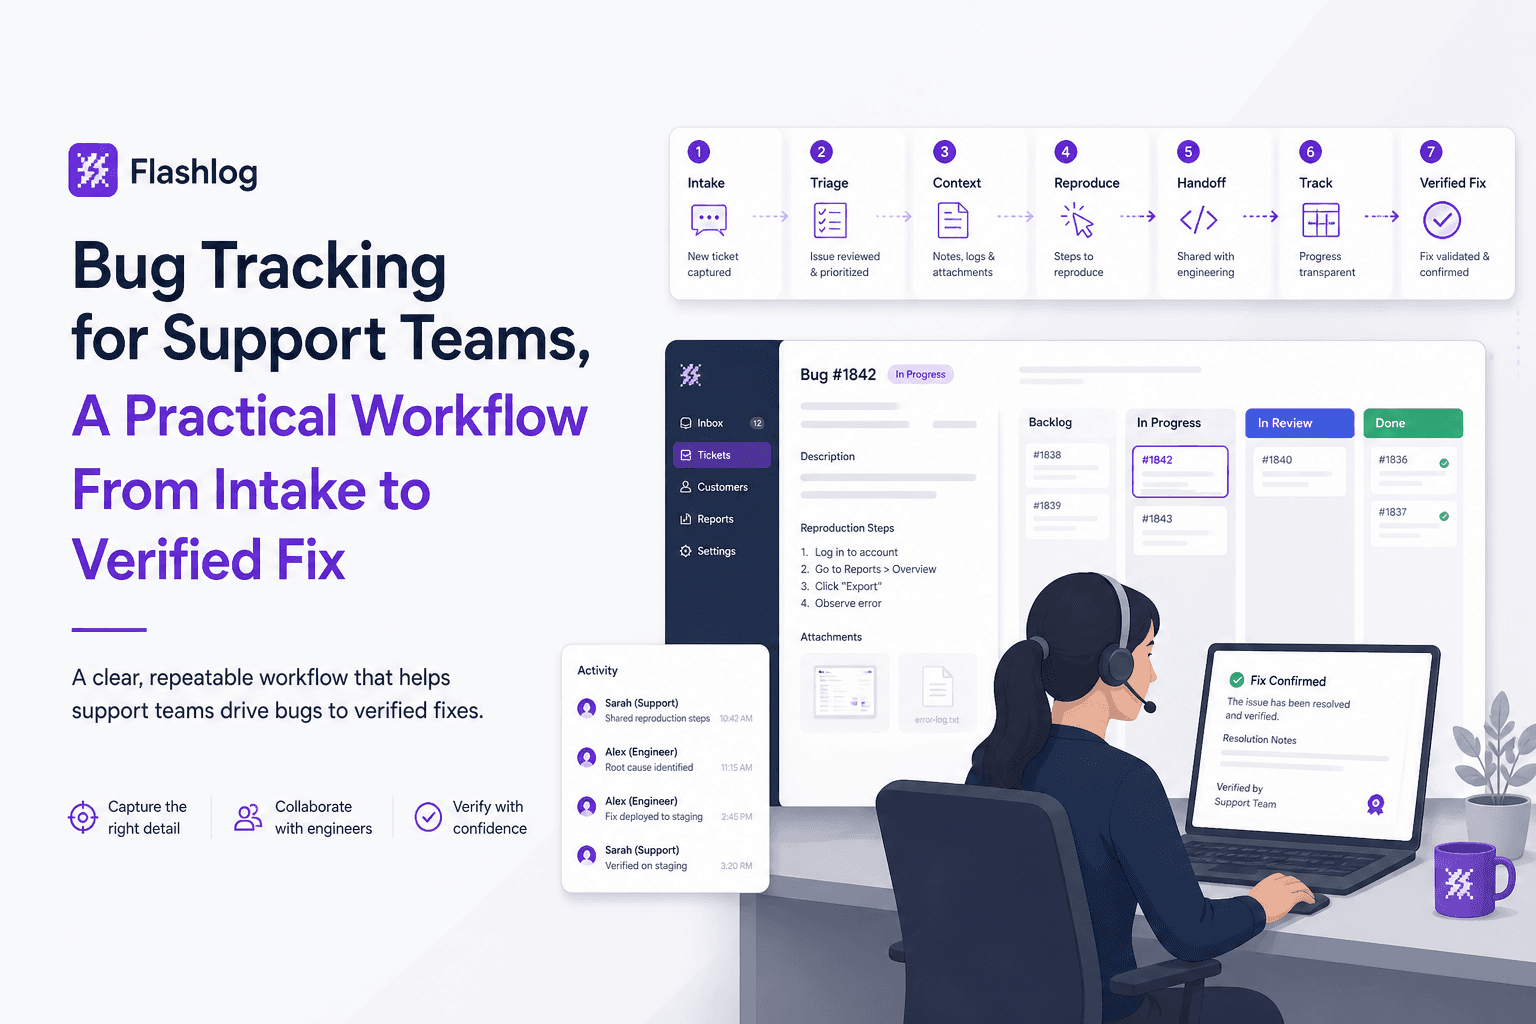
Bug Tracking for Support Teams, A Practical Workflow From Intake to Verified Fix
Bug tracking playbook for support teams: owners, templates, SLAs, and KPIs to turn noisy tickets into verified fixes and reduce defect leakage.
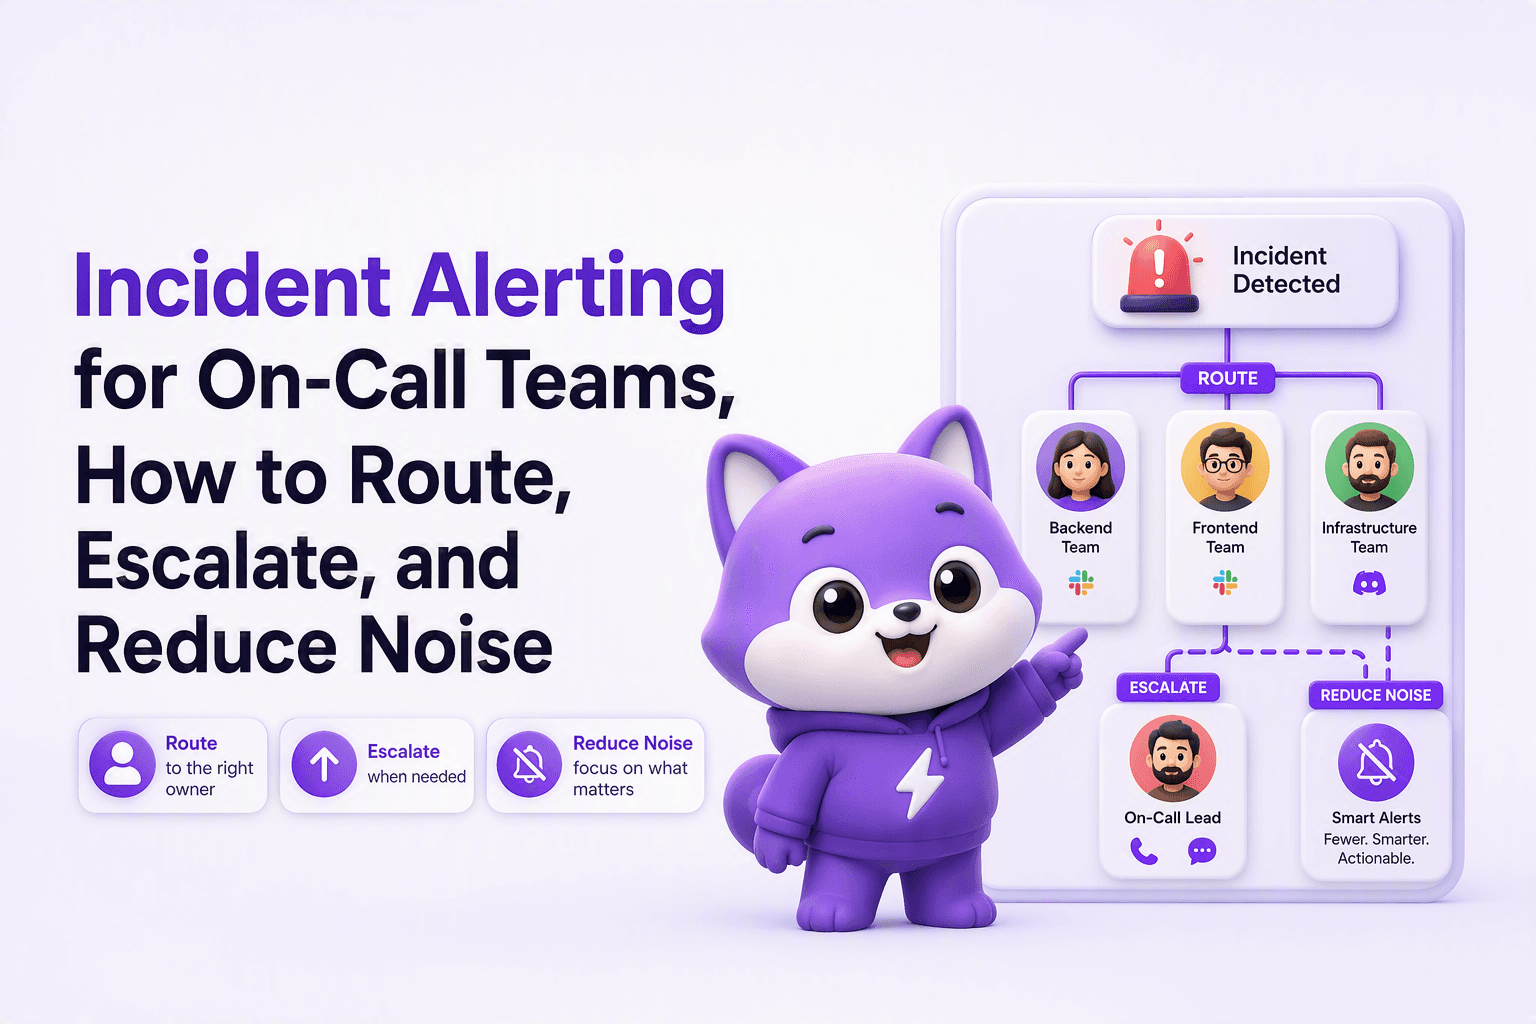
Incident Alerting for On-Call Teams, How to Route, Escalate, and Reduce Noise
A practical incident alerting framework: route by owner, set severity thresholds, dedupe noise, and escalate alerts into incidents with clear rules.

Machine Learning Anomaly Detection That Reduces Alert Noise, Models, Thresholds, and Examples
Learn machine learning anomaly detection by data type, pick models, tune thresholds, and evaluate to reduce false positives in production alerts.