
Log Analyzer Workflow For Noise Reduction, Queries, Correlation, And AI Triage
A log analyzer workflow reduces production noise by filtering, correlating, and summarizing events before they become engineering distractions. Teams using modern observability practices need a repeatable process that turns raw logs into actionable signals through collection, parsing, normalization, correlation, and alert decisions. The goal is not collecting more data, but improving the quality of decisions made from that data.
- A reliable workflow separates useful production signals from expected failures, duplicates, and uncertain events.
- AI capabilities should be measured through false positive reduction, explainability, and classification accuracy rather than automation claims alone.
- The right log analyzer combines rules, correlation, and AI-assisted context analysis to improve incident response.
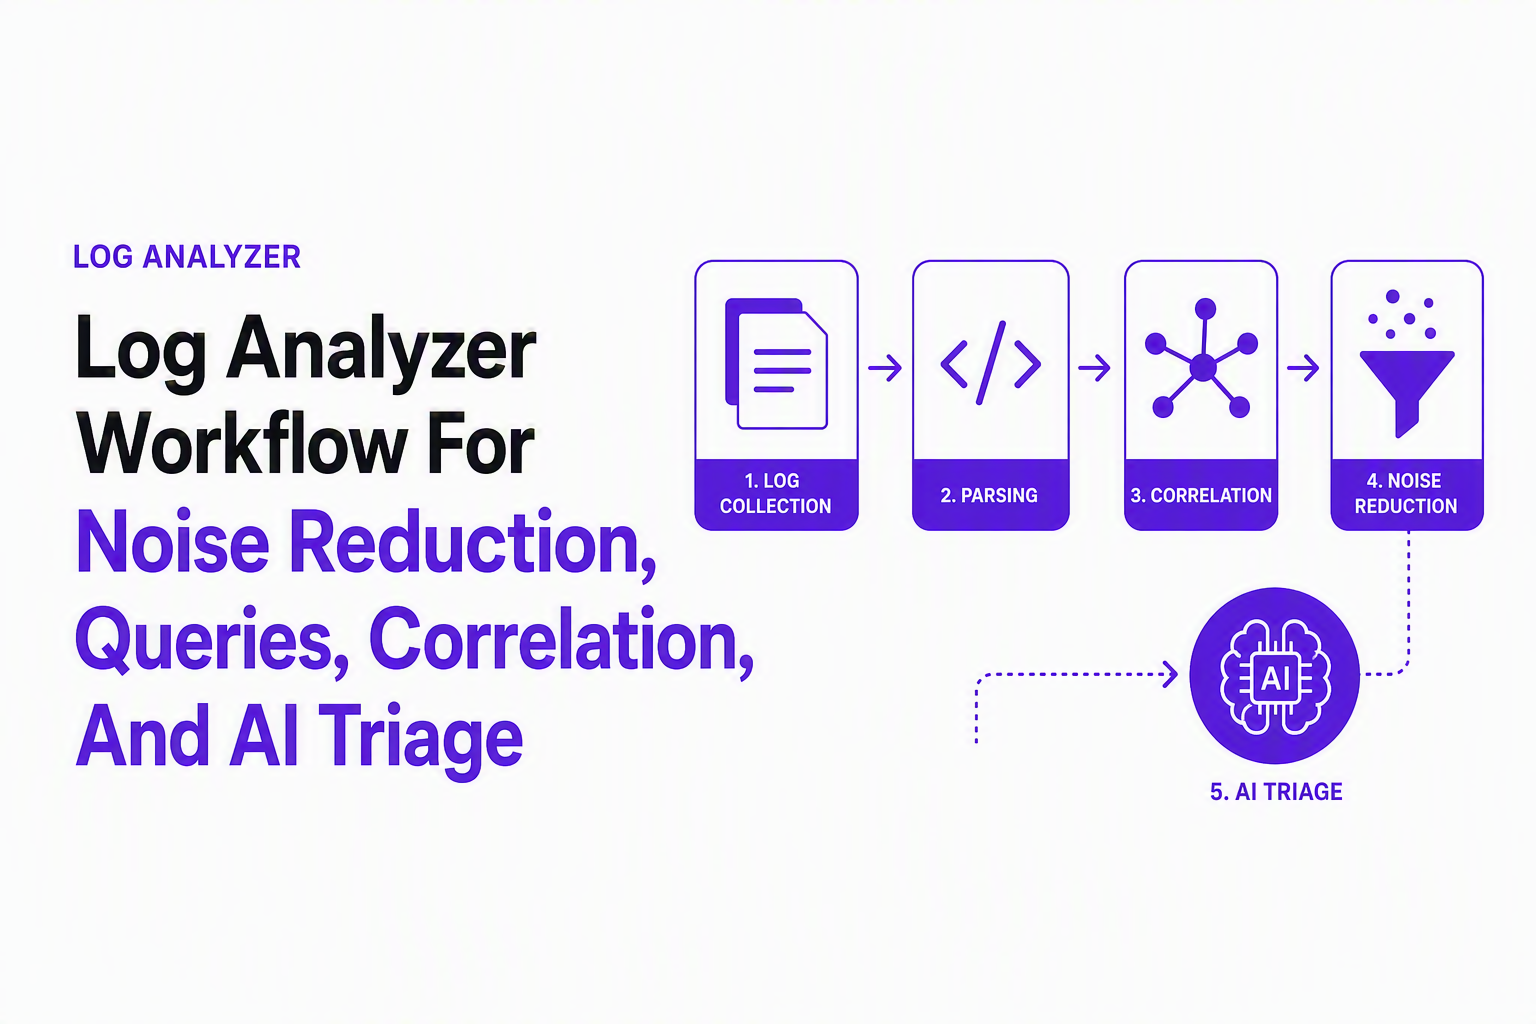
The Log Analyzer Workflow That Actually Reduces Noise Uses Five Controlled Steps
A practical log analyzer process reduces noise by moving every event through collection, parsing, normalization, correlation, and alert evaluation before engineers receive it.
Step 1: Collect production events with clear scope
Start by defining which applications, services, endpoints, and environments matter. A useful collection strategy avoids treating every event as equally important. Teams should document event sources, retention needs, and ownership before building automation.
Step 2: Parse and normalize logs into comparable data
Parsing converts inconsistent messages into structured fields such as timestamp, service name, endpoint, status code, error type, and user impact. Normalization makes correlation possible because similar failures can be recognized even when their raw messages differ.
Step 3: Correlate related events before alerting
Correlation connects repeated failures, shared fingerprints, and related requests. A single checkout failure appearing hundreds of times should usually become one investigation thread instead of hundreds of alerts. Teams evaluating correlation should measure duplicate ticket reduction and investigation time.
When we tested event grouping approaches, the key improvement was not fewer logs but fewer separate decisions engineers had to make. Our team found that grouping context around one issue made triage discussions faster and more consistent.
Step 4: Apply alert decisions based on impact
Alert rules should distinguish between expected business behavior and engineering failures. Rate limits, validation errors, and declined payments may require tracking but not immediate escalation. Decision criteria should include user impact, recurrence, severity, and confidence.
Step 5: Review outcomes and refine filters
A workflow improves when teams review missed signals, unnecessary alerts, and classification errors. Regular audits help prevent rule drift and ensure that automation continues matching real production conditions.
Hands-On Examples Show How Queries And Correlation Improve Incident Analysis
Log analyzer queries improve incident analysis when they connect raw events with service context, user impact, and repeated failure patterns.
Example log investigation workflow
Consider these sample events:
2026-09-19 10:14:22 POST /api/checkout 500 payment_service_timeout
2026-09-19 10:14:25 POST /api/checkout 500 payment_service_timeout
2026-09-19 10:15:02 POST /api/checkout 500 payment_service_timeout
A basic search may return three errors, but correlation should identify one failure pattern. A query such as service=checkout AND status=500 AND endpoint=/api/checkout helps isolate the affected flow. Adding a time window and grouping by error fingerprint reveals whether the issue is growing or stabilizing.
Correlation criteria during root cause analysis
Teams should evaluate related events using criteria such as identical stack traces, matching endpoints, shared deployment versions, and similar user journeys. Good correlation answers three questions: Are these events the same issue, what changed before the issue appeared, and how many users are affected?
For broader investigation, teams can combine log analysis practices with log correlation methods to connect symptoms with likely causes.
De-duplication decisions
A useful system creates one issue when multiple events share the same root cause. The evaluation checklist includes fingerprint quality, occurrence counting, related-event grouping, and visibility into why events were merged.
AI Log Analyzer Capabilities Should Be Measured By Accuracy And Explainability
AI log analyzer capabilities reduce noise when they classify events with measurable criteria instead of replacing human judgment with unclear automation.
Compare rules, machine learning, and LLM-based triage
Rules are effective for known patterns such as ignored endpoints or expected status codes. Machine learning can identify changing patterns, while LLM-based approaches can summarize context and explain likely causes. The strongest workflows usually combine deterministic rules with AI-assisted interpretation.
Evaluation checklist for AI features
- False positives: How often does the system create unnecessary investigation work?
- False negatives: How often does it hide important production issues?
- Explainability: Can engineers understand why an event was grouped, ignored, or escalated?
- Drift handling: Does performance change as applications evolve?
- Human control: Can teams adjust rules and confidence thresholds?
What surprised our team was that confidence explanations often mattered as much as classification speed. Engineers trusted automation more when the system showed the reasoning behind a decision.
AI-based bug capture and classification can also support existing logging workflows by capturing production issues even when users do not report them, categorizing events, and grouping similar problems for faster review. Flash Log applies this approach by adding an AI decision layer between raw production events and engineering workflows.
Choosing A Log Analyzer Requires A Checklist For Deployment And Operations
Choosing a log analyzer requires comparing deployment model, control level, integration options, and noise reduction capabilities before adoption.
Decision checklist
| Criterion | Questions to evaluate |
|---|---|
| Data handling | Can the system collect and process the required logs securely? |
| Correlation | Does it group repeated failures into meaningful issues? |
| AI capabilities | Are classifications explainable and adjustable? |
| Integrations | Can outputs reach Jira, Slack, Linear, or existing workflows? |
| Operations | Will teams maintain rules without excessive effort? |
Open source, SaaS, and managed approaches
Open source options provide customization and control but may require more operational ownership. SaaS platforms often reduce maintenance work while introducing vendor considerations. Managed approaches should be evaluated by reliability, integration depth, and transparency of automated decisions.
In our experience working with engineering teams, adoption depends less on the volume of collected data and more on whether teams trust the final issue stream. A smaller set of reliable signals usually supports better incident habits than an unlimited alert feed.
Teams should also connect production investigation habits with debug in production and issue triage processes.
Frequently Asked Questions
Start a practical noise reduction pilot with Flash Log by testing AI-driven bug capture and classification alongside your existing logging workflow. Flash Log helps teams filter unnecessary signals, group related production issues, and move clearer problems toward engineering action this week.
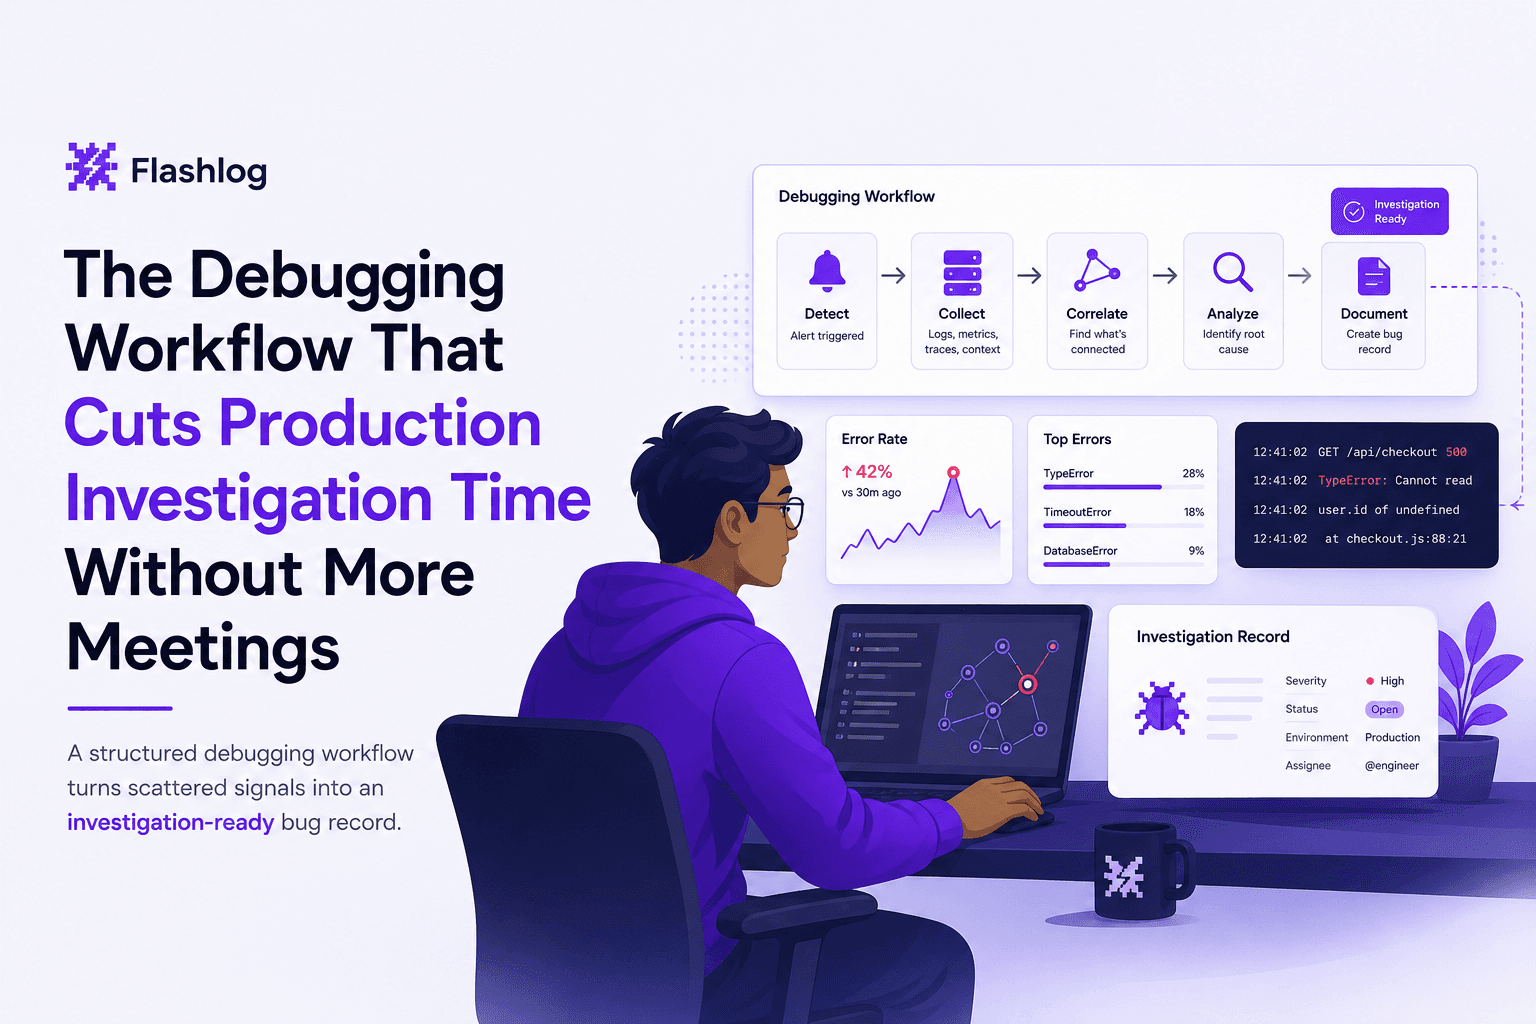
The Debugging Workflow That Cuts Production Investigation Time Without More Meetings
Learn a repeatable debugging workflow to debug production issues faster with clearer signals, faster triage, and less back-and-forth.
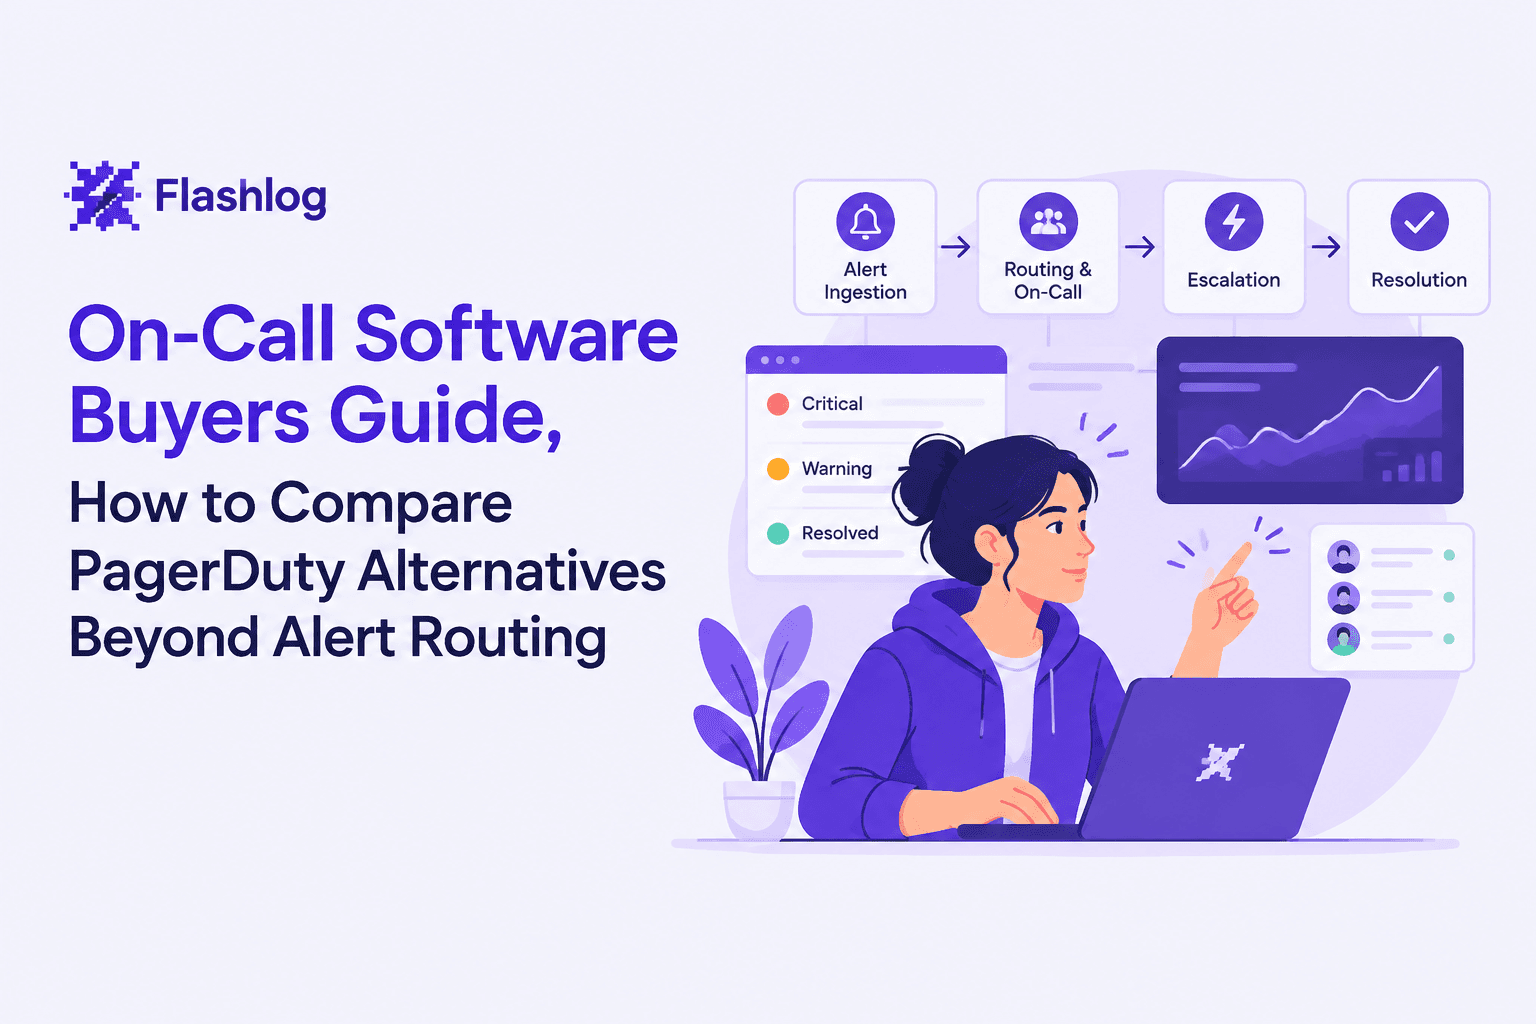
On-Call Software Buyers Guide, How to Compare PagerDuty Alternatives Beyond Alert Routing
Compare on call software beyond alert routing with a practical scorecard for PagerDuty alternatives, fit-by-team, integrations, and total cost.
Log Filtering That Actually Reduces Noise, A Practical Framework and Cheat Sheet
A practitioner framework for log filtering that reduces noise without losing forensic signal, plus a cross-tool cheat sheet and validation checklist.