
Log Sampling That Doesn’t Hide Incidents, How to Set Rates With Cost and SLO Math
Log sampling is the practice of intentionally keeping only a subset of log events so you can cut ingestion cost and noise while still preserving enough evidence to debug incidents and protect SLOs.
- Pick sampling rates from a budget and an SLO-driven error bar, not from a vague “10% everywhere” rule.
- Use a tiered policy: always-keep for high-risk events, filtered and aggregated for expected noise, and sampled for high-volume low-risk streams.
- In .NET, enforce consistency with structured logging, EventId, and correlation-safe scopes so sampled logs remain debuggable.
What Log Sampling Is Really Doing in Your Observability Pipeline
Log sampling changes which production realities make it into your searchable log store, and that directly changes what your downstream investigations can prove.
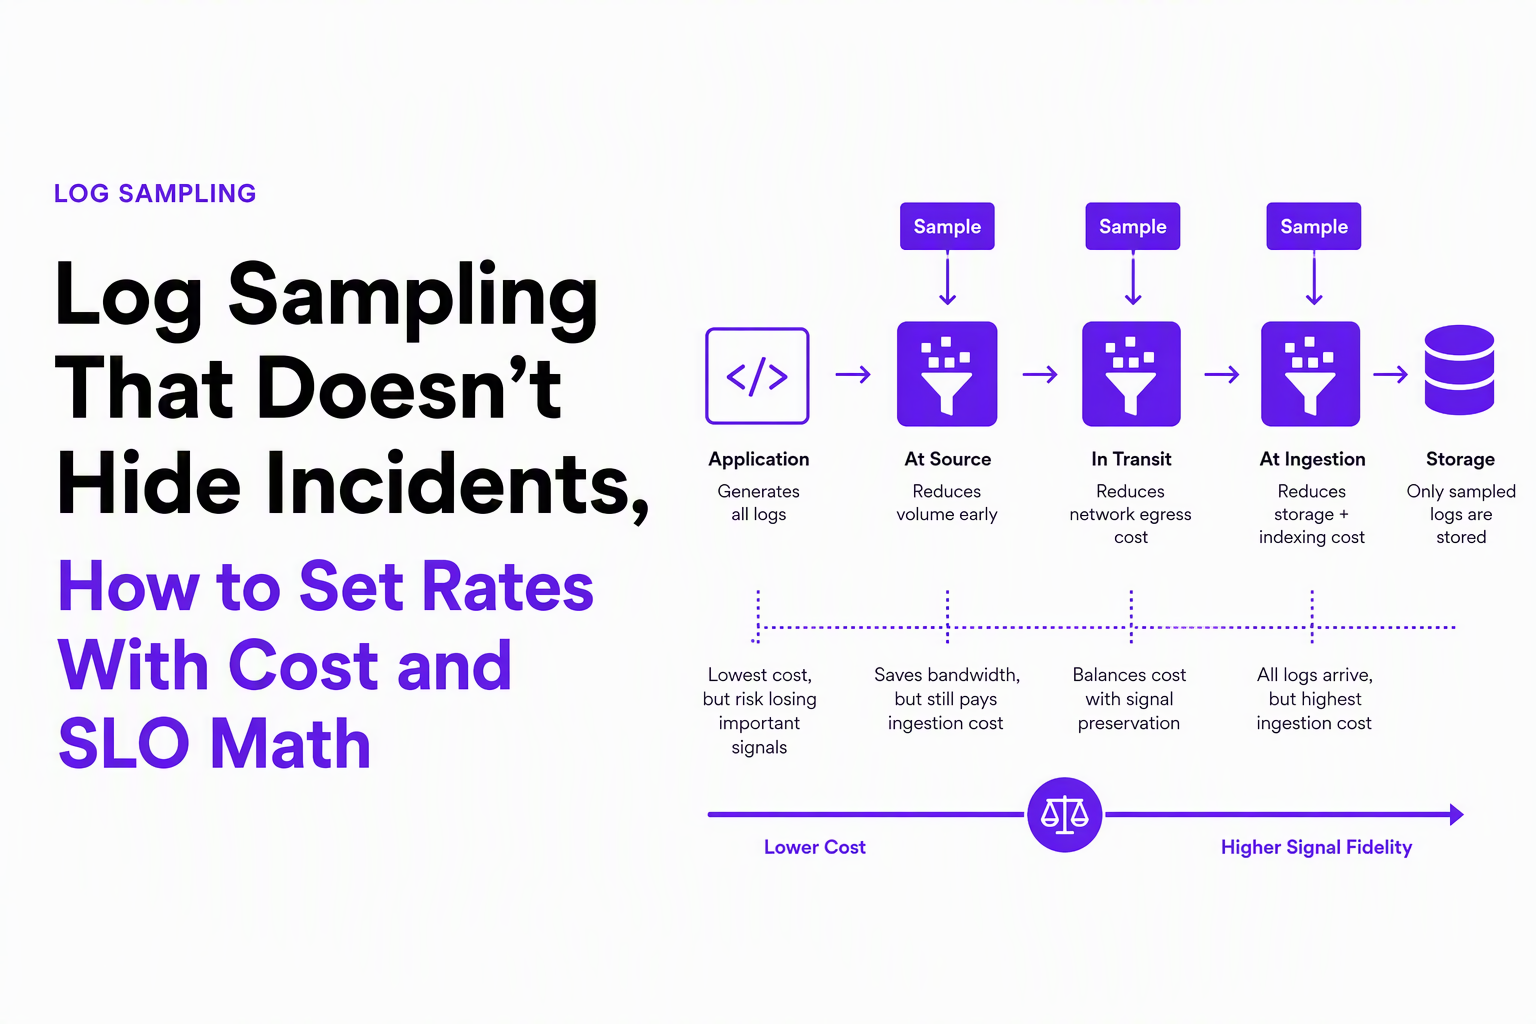
Where sampling can happen and what it breaks
In practice, sampling can happen at four different points, and each point has different failure modes:
- In-app (before export): you decide in code which events to emit. You save CPU and network, but you can permanently lose evidence (for example, missing the only log that contains a user identifier).
- Agent/collector (on host): a sidecar or daemon drops a portion of events. This preserves app simplicity, but can bias by container, host, or rollout ring if not configured carefully.
- Pipeline (ingest/processor): sampling in a central processor is easier to govern and change, but you still pay the cost of shipping logs to the pipeline and you may lose ordering across streams.
- Query-time (in the UI): you keep all data, but only view a subset for speed. This reduces analyst time but does not reduce ingestion costs.
How sampling affects your “truth surface” during incident response
During a live incident, engineers typically do three things: correlate by request or trace, count errors by endpoint, and search for “first occurrence” context. Log sampling can damage all three unless you design around it. For example, if you sample individual events independently, an error might be kept but the surrounding context logs for the same request might be dropped, making log correlation much weaker.
When we audited a high-volume API, the biggest surprise was that our sampling problem was not “missing errors” but “missing the one context line that explained the error,” so we moved from per-event sampling to request-scoped sampling for key routes.
A pipeline mental model that keeps you honest
To design a log sampling policy that does not hide incidents, treat your pipeline as three layers: (1) capture, (2) decide, (3) route. Sampling belongs in the “decide” layer, alongside filtering and aggregation. This is the same layer where you should also prevent duplicate floods and expected business failures from turning into work, because sampling alone only reduces volume, not interruptions.
The Four Sampling Types and When Each One Fails
Sampling strategies fail when they introduce bias that hides rare-but-critical behaviors, so you should choose the sampling type based on the question you need to answer during debugging.
1) Uniform random sampling (per event)
Use when: you need an unbiased view of high-volume homogeneous events (for example, informational access logs where you mainly compute rates). Fails when: you need full context around an error, or when events are highly bursty. Uniform sampling is mathematically clean but operationally blunt: it can keep an exception while dropping the request payload summary or user segment label that made the exception actionable.
2) Probabilistic sampling with stratification (by endpoint, status, tenant)
Use when: different partitions have different value and volume. Stratifying by endpoint or status can keep coverage on rare routes while still shrinking noisy routes. Fails when: partitions are not stable (for example, dynamic tenant IDs) or when cardinality explodes, creating config drift and accidental “no logs for this tenant” gaps.
3) Deterministic sampling (hash-based)
Use when: you must keep consistency across distributed systems, such as “keep 1% of requests but keep all logs for those requests.” A common pattern is sampling by hashing a stable key like traceId or requestId, then keeping all events that share that key. Fails when: the key is missing, changes mid-flight, or is not truly random (for example, sequential IDs can create uneven selection).
4) Adaptive sampling (rate changes based on load or error signals)
Use when: traffic changes wildly, and you want stable cost while preserving signal during anomalies. Fails when: your adaptation rules are coupled to the same sampled data, creating feedback loops (for example, sampling drops errors, so your “increase sampling on error spike” never triggers).
Choosing by incident question, not by elegance
A practical heuristic: if your primary incident workflow depends on reconstructing a single user journey, prefer deterministic request-scoped sampling; if it depends on accurate rates across a fleet, prefer stratified random sampling; if it depends on “keep everything during anomalies,” add an adaptive override that is triggered by metrics, not by sampled logs. For deeper investigation workflows, pair sampling with a clean log analysis playbook so teams do not mistake “no evidence” for “no problem.”
A Reproducible Way to Choose a Sampling Rate Using Cost and SLO Error Bars
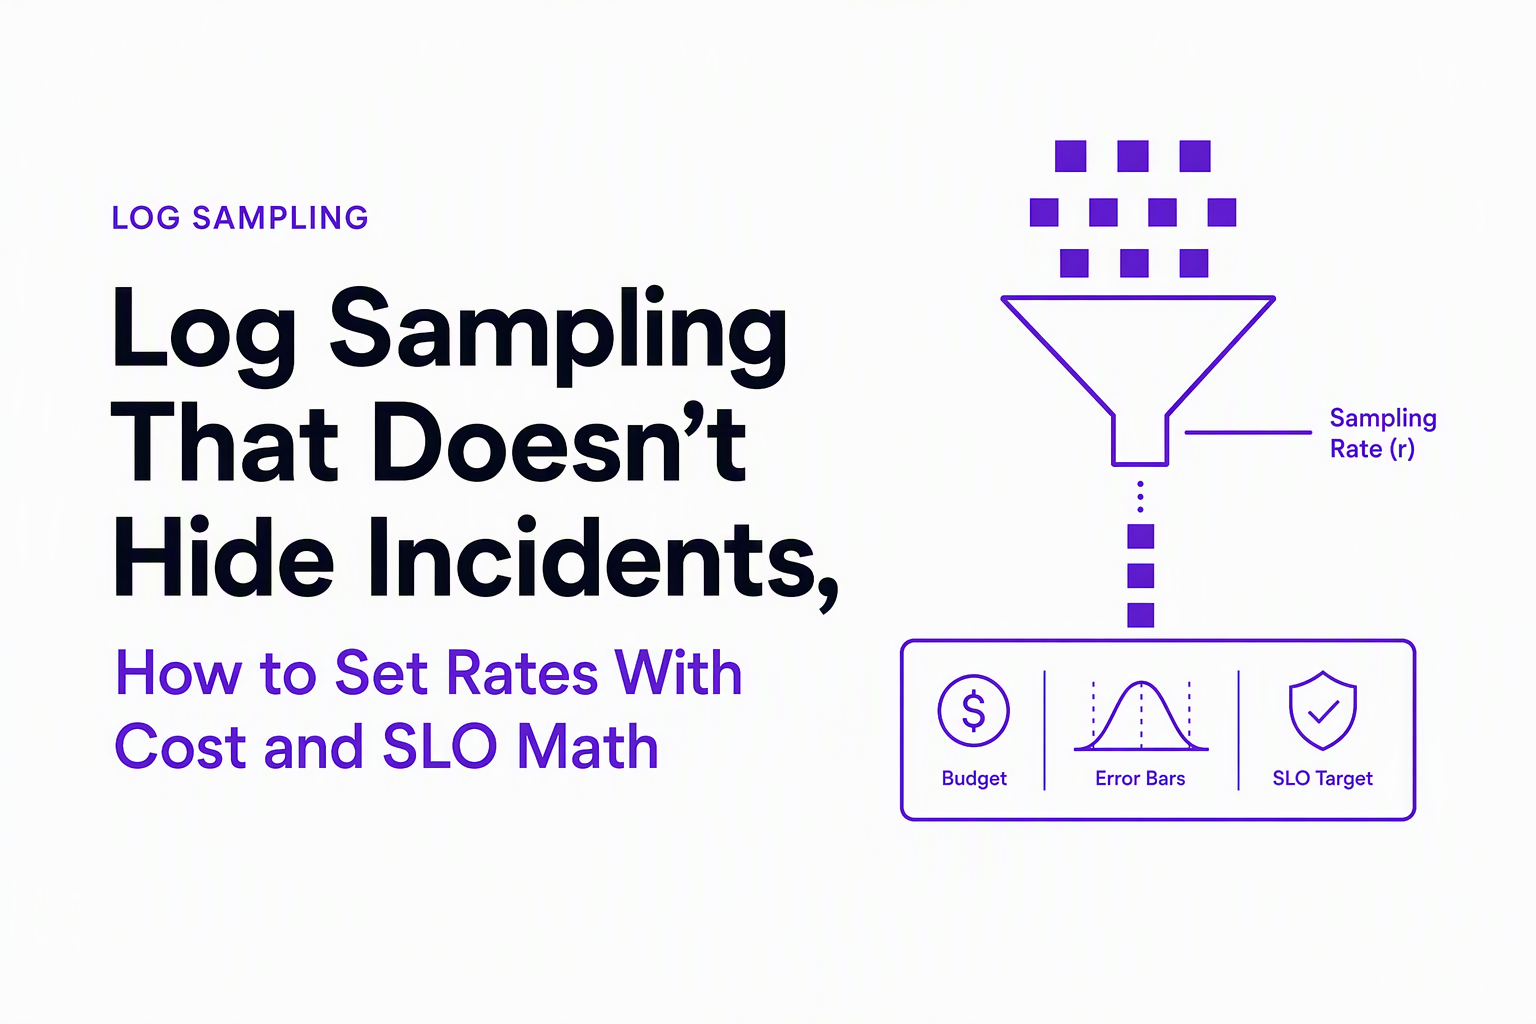
A defensible sampling rate comes from two numbers you can explain to finance and on-call engineers: a log budget in events per day and an acceptable error bar on the rate you use to detect SLO-threatening changes.
Step 1: Convert your cost limit into an event budget
Vendors price differently, so keep this calculation vendor-agnostic by budgeting in events (or bytes). Define:
- E_total = expected total events/day produced by the system (from agent counters or app metrics).
- E_budget = maximum events/day you are willing to ingest/store for logs.
- p_cost = E_budget / E_total (the maximum sampling probability allowed by cost).
Example: if you produce 500 million log events/day and you can afford to ingest 50 million/day, then p_cost = 0.10.
Step 2: Compute the sampling rate needed for a measurable error rate
If you use sampled logs to estimate an error rate, the sample size drives the confidence interval. For a quick, operationally useful bound, you can use the normal approximation for a binomial proportion when n is large and p is not extremely tiny. Let:
- r = true error rate you care about (for example, 0.1% or 0.001).
- n = number of sampled requests/events in the window.
- z = 1.96 for a 95% confidence interval.
The standard error for the estimated proportion is approximately sqrt(r(1-r)/n). If you want the half-width of the 95% interval to be at most e, you need:
n ≥ z² * r(1-r) / e²
Concrete example: you want to detect an error rate around r = 0.001 with an error bar e = 0.0002 (plus or minus 0.02 percentage points) at 95% confidence.
- z² ≈ 3.84
- r(1-r) ≈ 0.001 * 0.999 ≈ 0.000999
- e² = (0.0002)² = 4e-8
So n ≥ 3.84 * 0.000999 / 4e-8 ≈ 95,900 sampled requests in the measurement window.
Step 3: Turn the required n into a sampling probability
If your service handles N requests in that window, then sampling probability p_slo must satisfy:
p_slo ≥ n / N
If you have N = 10 million requests/hour and you need n ≈ 96k/hour, then p_slo ≥ 0.0096, roughly 1% request-scoped sampling to get that error bar.
Step 4: Choose the rate as the maximum of cost and SLO constraints, then tier it
Your baseline log sampling rate should satisfy both: p ≥ p_slo and p ≤ p_cost. If p_slo exceeds p_cost, that is a signal to stop using logs for that SLO measurement and rely on metrics instead, or to adjust the error bar and window. In our experience, teams get into trouble when they assume sampled logs can safely replace metrics for SLOs; sampled logs are best as forensic detail and rough validation, not the primary SLO source of truth.
Finally, apply the rate per tier (endpoint class, status class, tenant class) rather than globally, because the error rate you care about is rarely uniform across your system.
Sampling Without Blind Spots, A Tiered Policy Using Filtering, Aggregation, and Exemptions
A tiered policy prevents log sampling from hiding incidents by reserving full fidelity for high-risk events, while aggressively filtering expected noise and sampling only the remaining high-volume low-risk streams.
The tiered policy framework (3 layers)
- Always-keep: security, compliance, and high-severity engineering signals that must remain complete.
- Filter or aggregate: expected business failures and repetitive bursts that create noise but do not add debugging value per occurrence.
- Sample: high-volume diagnostics and success-path chatter, ideally with deterministic request-scoped sampling for correlation.
Checklist for building the policy
- Define “debuggability invariants”: which fields must be present when an incident happens (traceId, requestId, endpoint, status, tenant, build version).
- List always-keep classes: auth failures with suspicious patterns, permission checks, data-loss risks, payment processing faults, background job failures.
- Identify expected failures to filter: validation errors, rate limits, known 404s on optional assets, user-declined actions.
- Replace burst duplicates with aggregation: keep one representative event plus a counter for repeats per fingerprint per time window.
- Add emergency overrides: a way to temporarily raise sampling for a route, tenant, or deployment ring during an investigation.
Rule table you can copy into an engineering RFC
| Log class | Examples | Default action | Why | Override |
|---|---|---|---|---|
| Security and audit | Admin actions, permission changes, auth anomalies | Always keep | Completeness required for investigations | Never sample |
| High-severity engineering faults | Unhandled exceptions, data corruption warnings | Always keep | Low volume, high value | Can also route to alerts |
| Expected business outcomes | Payment declined, validation failed, rate limited | Filter (ignore rule) | Noise without engineering action | Sample for analytics if needed |
| Duplicate storms | Same crash across many users | Aggregate by fingerprint | One issue plus occurrence count is actionable | Keep first N fully |
| Success-path access logs | 200 OK on hot endpoints | Sample deterministically | Preserve correlation for selected requests | Raise rate on incident |
Sampling plus filtering is how you prevent alert fatigue
Filtering “expected failures” removes work you were never going to do, while sampling reduces raw volume. Combining both reduces the probability of an alert storm caused by repetitive, low-actionability events.
Log Sampling in .NET, Practical Patterns With ILogger, EventId, and Structured Logging
.NET log sampling works best when you design for stable event identity (EventId) and correlation-safe context so you can drop volume without breaking investigations.
Pattern 1: Make EventId and structured fields non-optional
Sampling decisions often rely on “what kind of event is this,” and string parsing is brittle. Use EventId plus structured properties.
private static readonly EventId CheckoutFailed = new(21001, nameof(CheckoutFailed));

_logger.LogError(CheckoutFailed,
    ex,
    "Checkout failed for {TenantId} {UserId} {OrderId}",
    tenantId, userId, orderId);
Operational rule: if an event must be always-kept, give it a dedicated EventId and never log it as a generic message.
Pattern 2: Request-scoped deterministic sampling to preserve correlation
To keep full context for a subset of requests, sample by hashing a stable request identifier or traceId. The sampling decision should be made once per request and stored in scope.
using var scope = _logger.BeginScope(new Dictionary<string, object>
{
    ["TraceId"] = Activity.Current?.TraceId.ToString(),
    ["Sampled"] = sampler.ShouldKeep(Activity.Current?.TraceId.ToString())
});

if ((bool)scopeState["Sampled"]) {
    _logger.LogInformation("Request started {Path}", path);
}
Implementation note: wire the sampler so it is consistent across services that share the same trace, otherwise cross-service debugging becomes asymmetric.
Pattern 3: Provider-level filters for high-volume categories
In ASP.NET Core, category filters can reduce volume before it hits your exporter. This is not a full policy, but it is a useful guardrail for noisy framework logs.
builder.Logging.AddFilter("Microsoft.AspNetCore.Hosting.Diagnostics", LogLevel.Warning);
builder.Logging.AddFilter("Microsoft.EntityFrameworkCore.Database.Command", LogLevel.Warning);
Pattern 4: Keep “first N” of a fingerprint, then aggregate or sample
For exceptions that repeat, keep the first few occurrences in full and then roll up. Our team has found that keeping the first 3 to 5 full instances of a new fingerprint captures the variability you need for debugging without storing the next thousand duplicates.
Correlation safety and investigation UX
Even with log sampling, you want every kept event to be joinable by traceId/requestId and searchable by endpoint and build version. If you need deeper investigator workflows, pair this with a consistent log analyzer routine that starts from metrics or traces and then pulls the sampled request cohorts for narrative reconstruction.
Operational Guardrails and Governance, What Must Never Be Sampled
Governance prevents log sampling from becoming an accidental data-loss event by defining immutable retention classes, incident toggles, and an audit trail of policy changes.
Never-sample classes (define in writing)
- Audit and compliance logs: admin actions, permission grants, security-relevant configuration changes.
- Security detections: suspicious auth patterns, repeated token failures, privilege escalation indicators.
- Data integrity signals: corruption checks, migration failures, inconsistent state warnings.
- Financial and order finalization events: depending on your domain, these may require complete trails (coordinate with legal and security).
Incident mode and change control
Define an “incident mode” that can raise sampling rates and disable certain filters temporarily, with a time limit and a rollback path. This mode should be triggered from outside the logging pipeline, such as an incident command workflow, so it does not depend on sampled evidence.
After running multiple post-incident reviews, the pattern was clear: policies fail when engineers cannot answer “what changed” during a noisy week. Keep a simple audit log for sampling config changes (who, what, when, why), even if your main log store is sampled.
Proving that sampling is not hiding issues
Add two validation checks to your runbooks:
- Coverage check: compare unsampled counters (for example, request count and error count from metrics) to sampled log-derived counts adjusted by the sampling rate.
- Context check: for a random set of sampled traceIds, verify that key spans and logs exist end-to-end across services.
How AI Noise Reduction Complements Sampling, Keep Fewer Logs but Catch More Bugs
AI noise reduction complements log sampling by deciding which events deserve to become engineering work, even when you keep fewer raw logs.
Sampling controls volume, triage controls interruption
Log sampling reduces storage and query cost, but it does not inherently prevent low-value events from turning into tickets, alerts, or Slack spam. A separate decision layer can filter expected failures, deduplicate repeated event storms into a single evolving issue, and hold back low-confidence signals until more context appears. This separation matters because on-call fatigue is driven more by interruption rate than by total bytes ingested.
A realistic workflow that preserves signal under aggressive sampling
- Capture: collect runtime errors and broken journeys from production.
- Rules first: ignore known harmless routes, statuses, and flows.
- Group duplicates: fingerprint repeated failures and maintain an occurrence count.
- Classify: assess whether the context indicates a real bug versus an expected business response.
- Route clean output: only actionable, grouped issues reach Jira, Linear, or chat.
Where Flash Log fits (one mention, practitioner framing)
Flash Log is an example of this approach in practice: it captures and classifies bugs automatically with AI, including cases where users never report them, then filters expected failures, groups duplicates, and gates low-confidence signals before they become noisy tickets or alerts. If your log sampling policy is already aggressive, this style of decision layer can help you keep fewer logs while still surfacing high-signal issues for engineering triage and cleaner alert triage.
| Approach | Primary goal | Best for | Main risk | Mitigation |
|---|---|---|---|---|
| Log sampling | Reduce volume and cost | High-throughput logs, success-path chatter | Missing context for debugging | Deterministic request sampling, always-keep tiers |
| Filtering and ignore rules | Remove expected noise | Validation failures, known 404s, business declines | Over-filtering real regressions | Versioned rules, incident overrides |
| Aggregation and dedupe | Prevent duplicate floods | Crash storms, repeated 500s | Losing per-occurrence variance | Keep first N instances, store occurrence counts |
| AI triage | Recover signal and reduce interruptions | Large streams where humans cannot read everything | False positives or low-confidence guesses | Confidence gates, explainable decisions, human review loops |
FAQ
If you are tightening log sampling to control cost but still want high-signal bugs to reliably surface, pilot Flash Log as a decision layer that filters expected failures, groups duplicates, and uses AI classification to keep engineering workflows focused on actionable production issues.
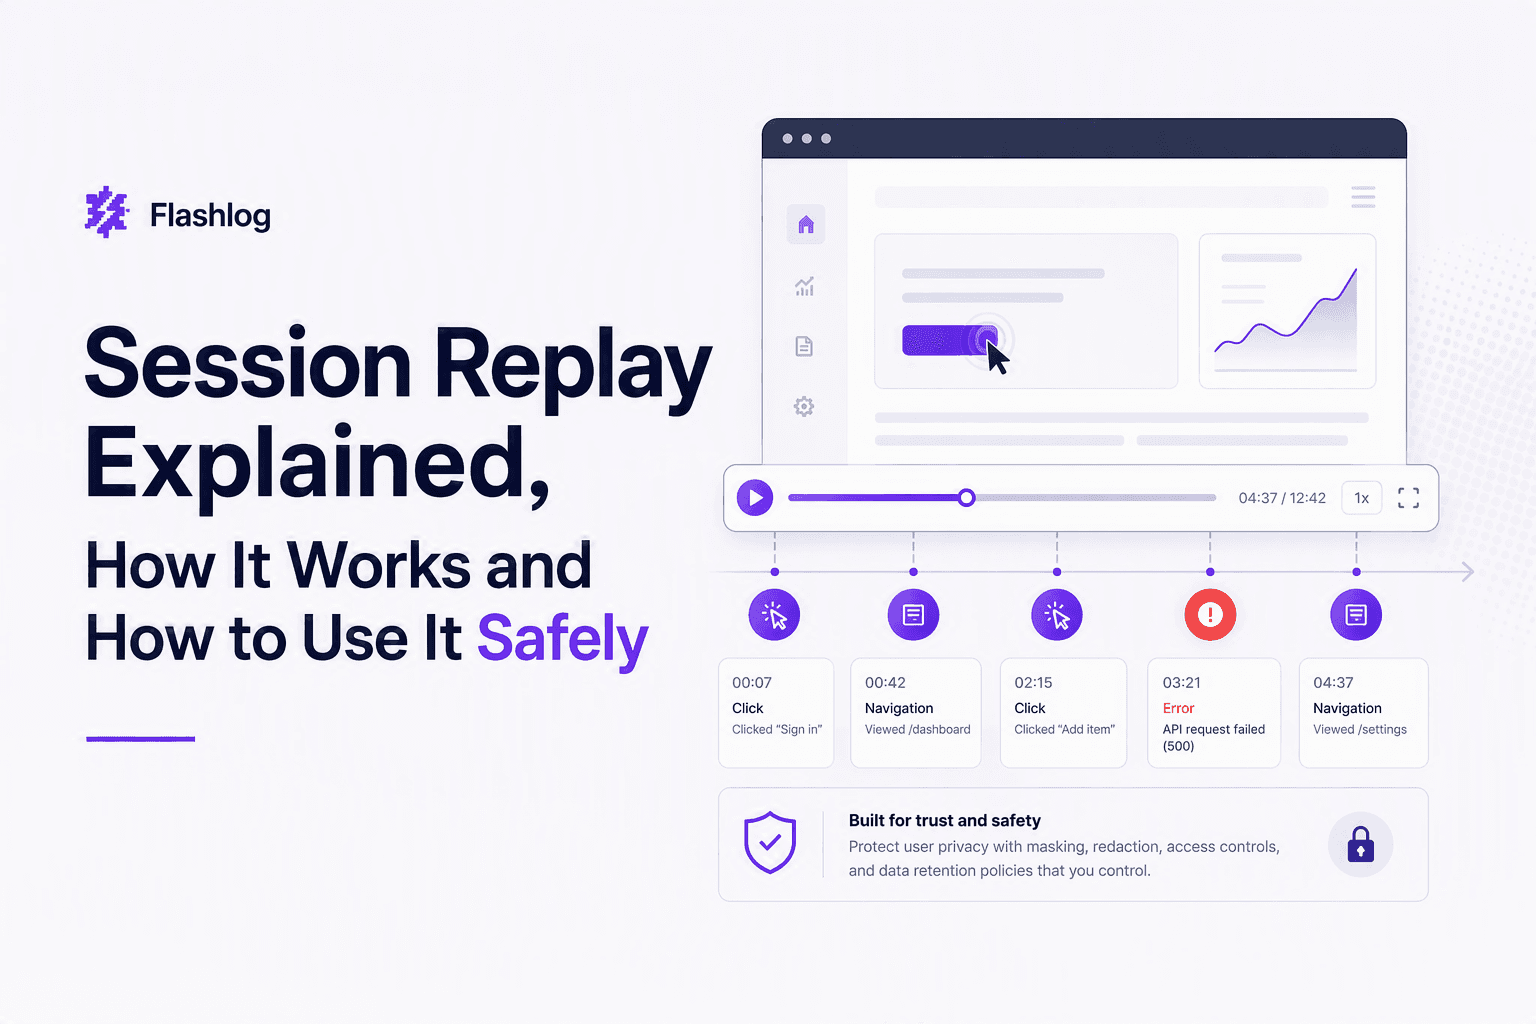
Session Replay Explained, How It Works and How to Use It Safely
Session replay explained for buyers: what it captures, how it works, and a practical privacy checklist and decision tree for safe deployment.
Hiding Masking Personally Identifiable Information in Session Replay, A Practical Framework
A practical framework for hiding masking personally identifiable information in session replay: what to mask, where to mask it, and how to validate.

Debug In Production Without Panic, A Safety-First Workflow for Live Issues
Learn how to debug in production safely with a containment-first workflow, guardrails, and checklists to fix live issues fast.