
Alert Fatigue Fix, A 30 60 90 Day Playbook to Cut Noise and Improve On-Call
Alert fatigue is what happens when on-call teams get paged for events they cannot or should not act on, until the safest human behavior becomes ignoring the channel. The fix is not “fewer alerts” in the abstract, it is a measurable system that raises actionable rate, reduces duplicate storms, and makes paging decisions consistent across services.
- Define “actionable” with one shared rule set (page vs ticket vs log-only) so humans stop arguing at 2 a.m.
- Baseline a small KPI set (actionable rate, duplicate rate, pages per shift, MTTA/MTTR) to prove improvement in 30/60/90 days.
- Combine hygiene (routing, dedupe, thresholds) with SLO-based paging policy and AI-assisted noise reduction to cut pages without hiding incidents.
Alert fatigue, alarm fatigue, and “actionable” need one shared definition
Alert fatigue is best treated as a classification problem: does this signal require a human response within minutes, within hours, or not at all. Teams in SRE, security, and even healthcare use different words (alert fatigue vs alarm fatigue), but the operational standard is the same: alerts must map to a defined action, owner, and time window.
Use one three-bucket model: Page, Ticket, Log-only
Make “actionable” concrete by forcing every signal into one of these buckets:
- Page (minutes): A human must respond now to reduce user impact or prevent imminent risk. Owner must be explicit (primary on-call) and there must be a runbook link.
- Ticket (hours to days): Needs engineering work, but does not require waking someone up. Owner is a team queue; response time is business hours.
- Log-only (no workflow): Useful for debugging or auditing, but not something you commit to handling. No alert, no ticket.
Clarify pronunciation and meaning so cross-functional teams stop talking past each other
People say “alert fatigue” and “alarm fatigue” interchangeably, and that is fine as long as your policy is explicit. In security, “actionable” often means “triageable with available context” and “low false positive.” In SRE, it typically means “tied to user-facing impact” and “time-sensitive.” In healthcare, it refers to alarm overload and habituation. Your on-call policy should adopt the SRE version: actionable equals a defined action that reduces impact within the escalation window.
A minimal actionable checklist you can put into code review
- Trigger: What condition fires, in one sentence.
- User impact: What the user cannot do (or what risk exists).
- Next action: One of: rollback, failover, disable feature, scale, mitigate, communicate.
- Owner: Role or rotation, not “someone.”
- Routing: page vs ticket, and which channel.
- Suppression: known maintenance windows or dependencies.
Alert fatigue happens because humans habituate to unreliable signals
Alert fatigue is driven by habituation: when most signals do not require action, the brain learns that the alert channel is low value and stops switching into “respond now” mode. The operational failure mode is not laziness, it is a rational adaptation to noise.
The “cry wolf” chain in on-call terms
In practice, the chain looks like this:
- Low precision: too many alerts are false positives or non-actionable.
- Slower acknowledgment: responders wait to see if anyone else reacts.
- Weaker triage: people skim and guess, because there are too many to read deeply.
- Missed signals: a real incident looks like the last 20 non-incidents.
- Policy decay: teams add more alerts “for safety,” worsening the channel.
One incident-style anecdote that matches what most teams see
After running several alert audits, the pattern was clear: the worst pages were rarely “wrong,” they were simply unhelpful because they repeated without adding new information. Our team once had a frontend error page fire hundreds of times during a deploy, and the first 30 pages trained everyone to ignore the next 300, including the one that finally included the stack trace that pointed to the real regression.
Where noise usually comes from (and who owns it)
- Expected business failures (product/engineering): validation errors, permission denials, payment declines.
- Duplicate event storms (platform/engineering): one bug produces many identical pages.
- Low-context alerts (monitoring owners): threshold-only alerts with no user impact framing.
- Dependency churn (platform): transient upstream failures that should be budgeted or routed differently.
Measuring alert fatigue requires a small KPI set with explicit formulas
Alert fatigue is fixable when you track precision and load, not just total alert count. A team can cut alerts by 80% and still be worse off if actionable pages are delayed, so you need KPIs that connect noise reduction to response quality.
Baseline worksheet you can run in a day
Pull 2 to 4 weeks of paging events (PagerDuty, Opsgenie, Slack, or whatever you use) and create a simple sheet with these columns:
- Timestamp, service, alert name, severity
- Paging outcome: page, ticket, ignored, auto-resolved
- Actionability label (human-reviewed): actionable vs non-actionable
- Duplicate group ID (manual at first)
- Time to acknowledge (TTA) and time to resolve (TTR) if incident
Core KPI formulas (use these exact definitions)
- Actionable rate = actionable pages / total pages
- False page rate = non-actionable pages / total pages (inverse of actionable rate)
- Duplicate rate = pages that belong to an existing open issue / total pages
- Pages per on-call shift = total pages / number of shifts (normalize by rotation size)
- MTTA = median time to acknowledge for actionable pages
- MTTR = median time to resolve for incidents (use incident start to mitigation)
Targets that are realistic without pretending there is one industry benchmark
Targets vary by business and risk, so avoid borrowed numbers you cannot defend. Instead, commit to directional targets that are operationally meaningful:
- 30 days: identify top 10 noisy alerts, raise actionable rate by policy changes and dedupe work.
- 60 days: reduce duplicate rate materially by grouping and correlation, stabilize pages per shift.
- 90 days: improve MTTA for actionable pages by making routing and escalation consistent.
When we tested KPI baselining with teams that felt “everything is broken,” the surprise was that a small subset of alerts usually accounted for most pages, making early wins possible without a full observability rebuild.
A 9-step remediation workflow to get rid of alert fatigue in 30 60 90 days
Alert fatigue goes away when you run a remediation workflow with owners, outputs, and a review cadence, not when you do one-off threshold tuning. The workflow below is designed to show improvement within one quarter and keep it from regressing.
Step 1: Declare the decision rule for pages
- Owner: SRE lead or on-call owner
- Output: one-page paging policy draft (page vs ticket vs log-only)
- Cadence: once, then quarterly review
Step 2: Freeze net-new paging alerts for 7 to 14 days
- Owner: engineering manager on affected teams
- Output: exception process for truly critical new pages
- Why: prevents “add more alerts” while you clean the backlog
Step 3: Run an alert inventory and rank by page volume
- Owner: monitoring owner
- Output: top 20 alerts by count, plus top 20 by after-hours count
Step 4: Label the top offenders with actionability and duplicates
- Owner: on-call rotation members (shared)
- Output: labeled dataset for two weeks of pages
- Rule: if no clear action exists, it cannot stay a page
Step 5: Apply “noise gates” before routing
- Owner: platform or tooling engineer
- Output: suppression for expected business errors, ignore rules for known harmless endpoints/statuses, and confidence gating for uncertain signals
Step 6: Implement dedupe and grouping at the issue level
- Owner: platform or app team depending on source
- Output: fingerprinting rules so one root cause becomes one evolving issue with an occurrence count
- Review: weekly for the first month
Step 7: Rewrite each remaining page to include context
- Owner: alert authoring team
- Output: runbook link, impact statement, and “what changed” signals (deploy hash, region, customer segment if available)
Step 8: Add a lightweight weekly “alert court”
- Owner: on-call captain for the week
- Output: decisions: keep, downgrade to ticket, mute, or redesign
- Time box: 30 minutes, using top 10 pages from the week
Step 9: Lock in regression controls
- Owner: engineering leadership
- Output: code review checklist for new alerts and a quarterly KPI review
30 60 90 day rollout plan (who does what)
- Days 1 to 30: inventory, labeling, and fix the top 10 noisy pages; publish paging policy draft; start weekly alert court.
- Days 31 to 60: implement grouping and correlation; redesign context-poor pages; formalize routing rules and escalation paths.
- Days 61 to 90: convert threshold pages to SLO-based paging where possible; automate noise gates; set regression guardrails.
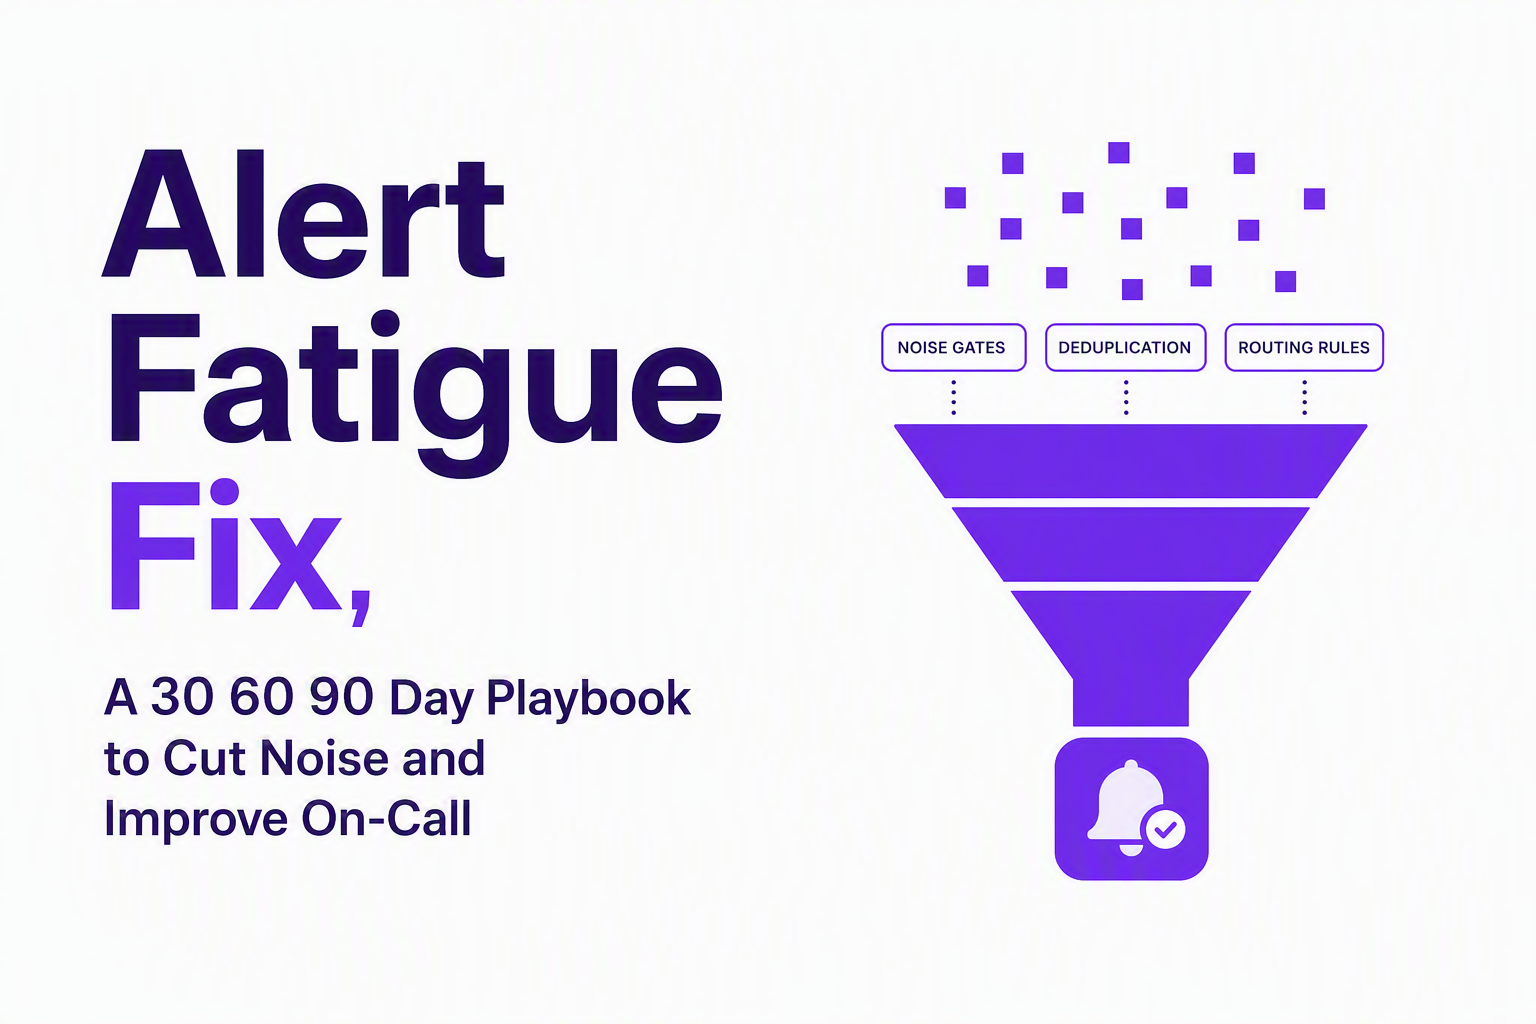
SRE paging policy that prevents fatigue uses SLO-based alerts and explicit routing
SRE paging policy prevents alert fatigue when paging is tied to user impact through SLOs, and everything else becomes a ticket or a dashboard. The goal is not perfect detection, it is consistent decisions that protect sleep while catching real outages.
Paging vs ticketing criteria you can enforce
- Page when: user-facing functionality is failing now, error budget burn indicates imminent SLO breach, or a security or data loss condition requires immediate mitigation.
- Ticket when: the issue is real but not time-critical, or when the fix is code-level and cannot be mitigated quickly.
- Do not alert when: the condition is expected business behavior, a known harmless flow, or the signal lacks enough context to decide.
Burn-rate example (conceptual, not a copy-paste)
A common pattern is to page on fast burn (big impact now) and ticket on slow burn (trend that needs work). For example, a fast-burn alert might trigger when recent error budget consumption projects an SLO breach soon, while a slow-burn alert triggers when the service is steadily degrading. Keep the numbers and windows in your SLO tooling so teams can defend the thresholds.
Routing rules and escalation paths that stop “broadcast paging”
Broadcast paging is a quiet source of alarm fatigue because too many people get pinged for the same event. Tie routing to ownership boundaries and impact:
- Primary route: service owner rotation.
- Secondary route: platform only if the symptom matches platform signals (for example, widespread latency across many services).
- Escalation: time-based escalation to a single backup, not the entire org. Document it with an escalation policy that names roles, not individuals.
For teams rebuilding their process, pairing routing with an incident alerting runbook and a simple alert management framework keeps decisions consistent as you scale.
AI noise reduction techniques that actually reduce pages focus on dedupe, correlation, and confidence gates
AI noise reduction techniques reduce alert fatigue when they stop false positives and duplicate storms before they become tickets or pages. The practical win is not a prettier dashboard, it is fewer interruptions for events your team was never going to fix.
Technique 1: Fingerprinting to group repeats into one evolving issue
Start with deterministic grouping: normalize stack traces, endpoints, error codes, and key tags into a fingerprint so 200 identical crashes become one issue with an occurrence count. This directly lowers duplicate rate and improves triage, because responders can see whether the issue is growing or fading.
Technique 2: Correlation across signals to avoid paging on symptoms
Correlation rules keep you from paging on downstream symptoms when an upstream cause is already known. Examples that work in week one:
- If many services error at once and the shared dependency is failing, page the dependency owner, ticket the dependent services.
- If error rate spikes immediately after a deploy, route to the deploying team and attach the deploy identifier.
- If the same user journey fails across many users, group by journey step and endpoint rather than by individual device logs.
Technique 3: Ignore rules for expected business errors
Expected failures should be measured but not paged. Common ignore candidates include rate limits, permission denials, validation errors, and “payment declined” responses that represent a normal business outcome. If you do need visibility, route these to product analytics or a weekly report, not to on-call.
Technique 4: Confidence gates to hold back low-context signals
A confidence gate holds alerts when the system cannot justify the classification, preventing uncertain events from becoming noisy tickets. In our experience, confidence gating is especially effective for “edge” errors where the same raw error might be either a real bug or an expected user path, and the deciding context lives in surrounding request metadata.
Where Flash Log fits (one mention, operationally)
If you want the noise gate to happen before engineers are interrupted, Flash Log can capture production failures even when users never report them, classify whether the behavior looks like a real bug or an expected outcome, and group repeated failures into a single issue fingerprint with an occurrence count before routing anything to Jira, Linear, Slack, or weekly review.
For deeper triage structure, pair the gating work with a lightweight alert triage routine, and make time to explicitly hunt false positives in the top offenders each week.
| Control | Best for | Owner | What to measure | Common failure mode |
|---|---|---|---|---|
| Page vs ticket policy | Stopping non-actionable pages | SRE/on-call owner | Actionable rate, MTTA | Policy exists but exceptions become the norm |
| Deduplication (fingerprinting) | Duplicate storms | Platform/app team | Duplicate rate, pages per shift | Fingerprints too broad, hiding distinct issues |
| Correlation rules | Paging on causes, not symptoms | Platform/SRE | MTTA, escalation count | Correlation too aggressive, suppressing real edge cases |
| Ignore rules | Expected business errors | App team/product + SRE | Non-actionable pages, ticket cleanliness | Muted signals become invisible without reporting |
| Confidence gating (AI-assisted) | Low-context, ambiguous events | Tooling owner | False page rate, reviewer override rate | Unreviewed backlog of “held” events |
FAQ
If you run the 30/60/90-day playbook above and want a practical way to stop duplicate storms and low-confidence signals before they hit Jira or Slack, Flash Log can auto-capture production bugs even when users do not report them, classify what deserves attention, and cluster repeats into one clean issue so your team can reduce alert fatigue without losing real incidents.
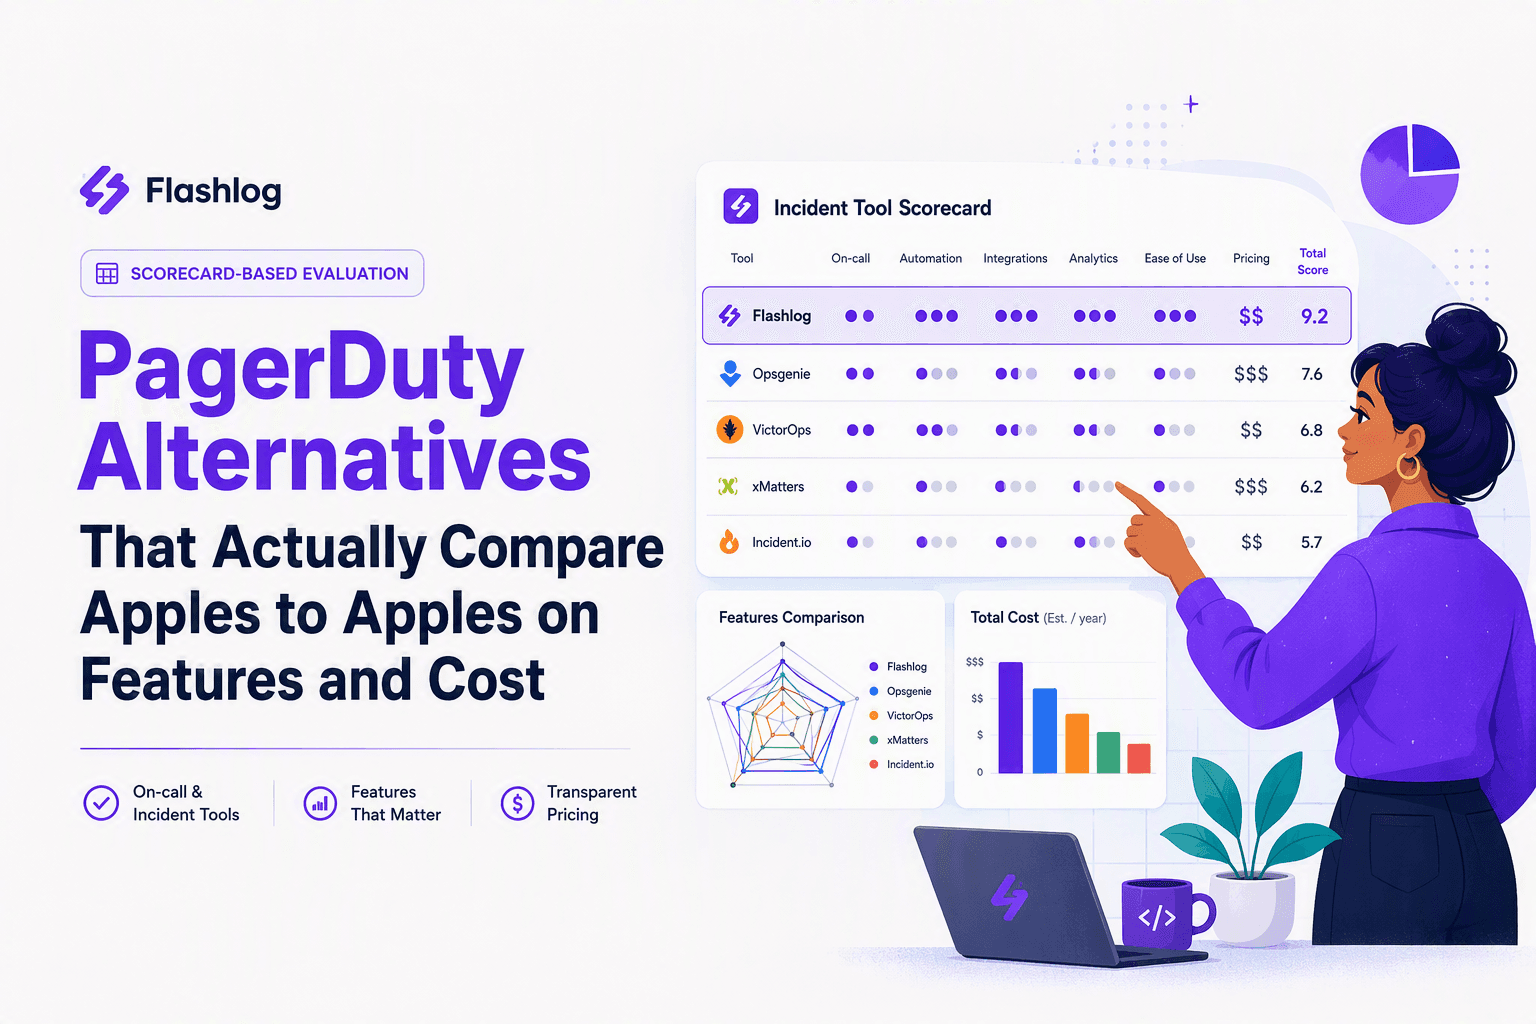
PagerDuty Alternatives That Actually Compare Apples to Apples on Features and Cost
A practical shortlist of pagerduty alternatives with a scorecard, normalized cost model, and a safe migration checklist for switching without breaking on-call.
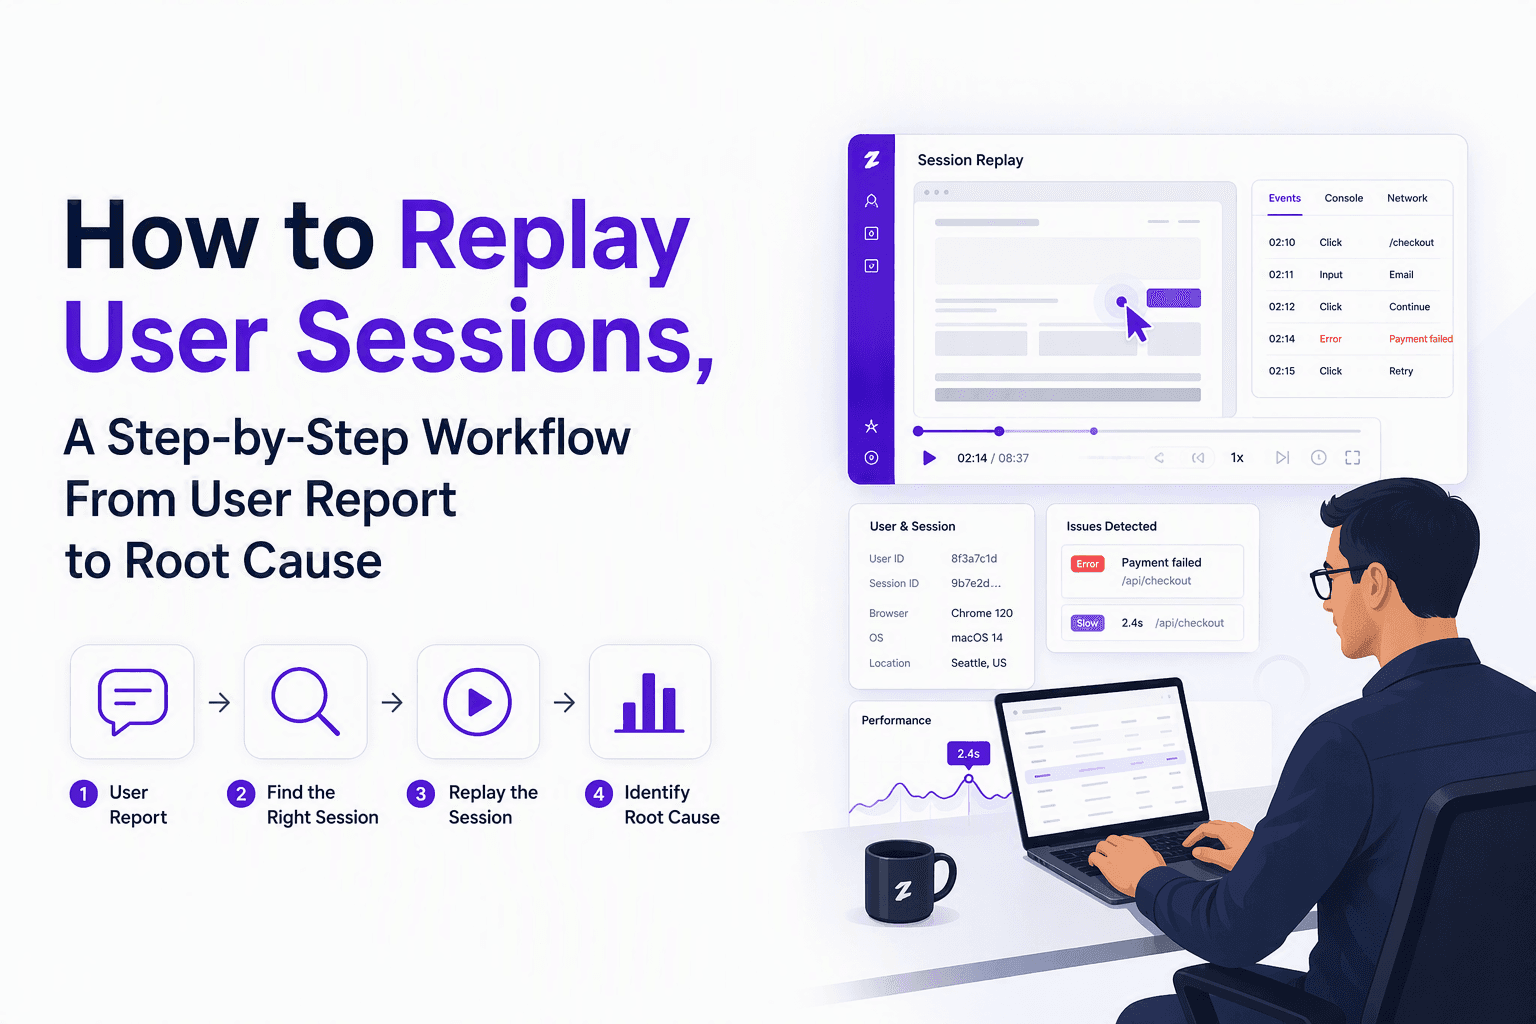
How to Replay User Sessions, A Step-by-Step Workflow From User Report to Root Cause
Learn how to replay user sessions with a practical workflow: find the right session, review signals, document findings, and share safely.
Notification Spam Explained and How to Stop It on Any Device
Notification spam explained in plain English, with steps to find the source and stop it on iPhone, Android, browsers, email, and SMS.