
Alert Management System Playbook for On-Call Teams, Routing, Deduping, Escalation, Metrics
An alert management system is the operating layer that turns raw monitoring signals into a small number of actionable pages for the right on-call people, with deduplication, routing, escalation, and measurement built in.
- Separate “detection” from “management”: route and dedupe after normalizing alerts, not inside every tool.
- Use a severity matrix and explicit escalation timelines so every page has an owner, a channel, and a next step.
- Instrument MTTA, MTTR, and a noise ratio so you can tighten rules without flying blind.
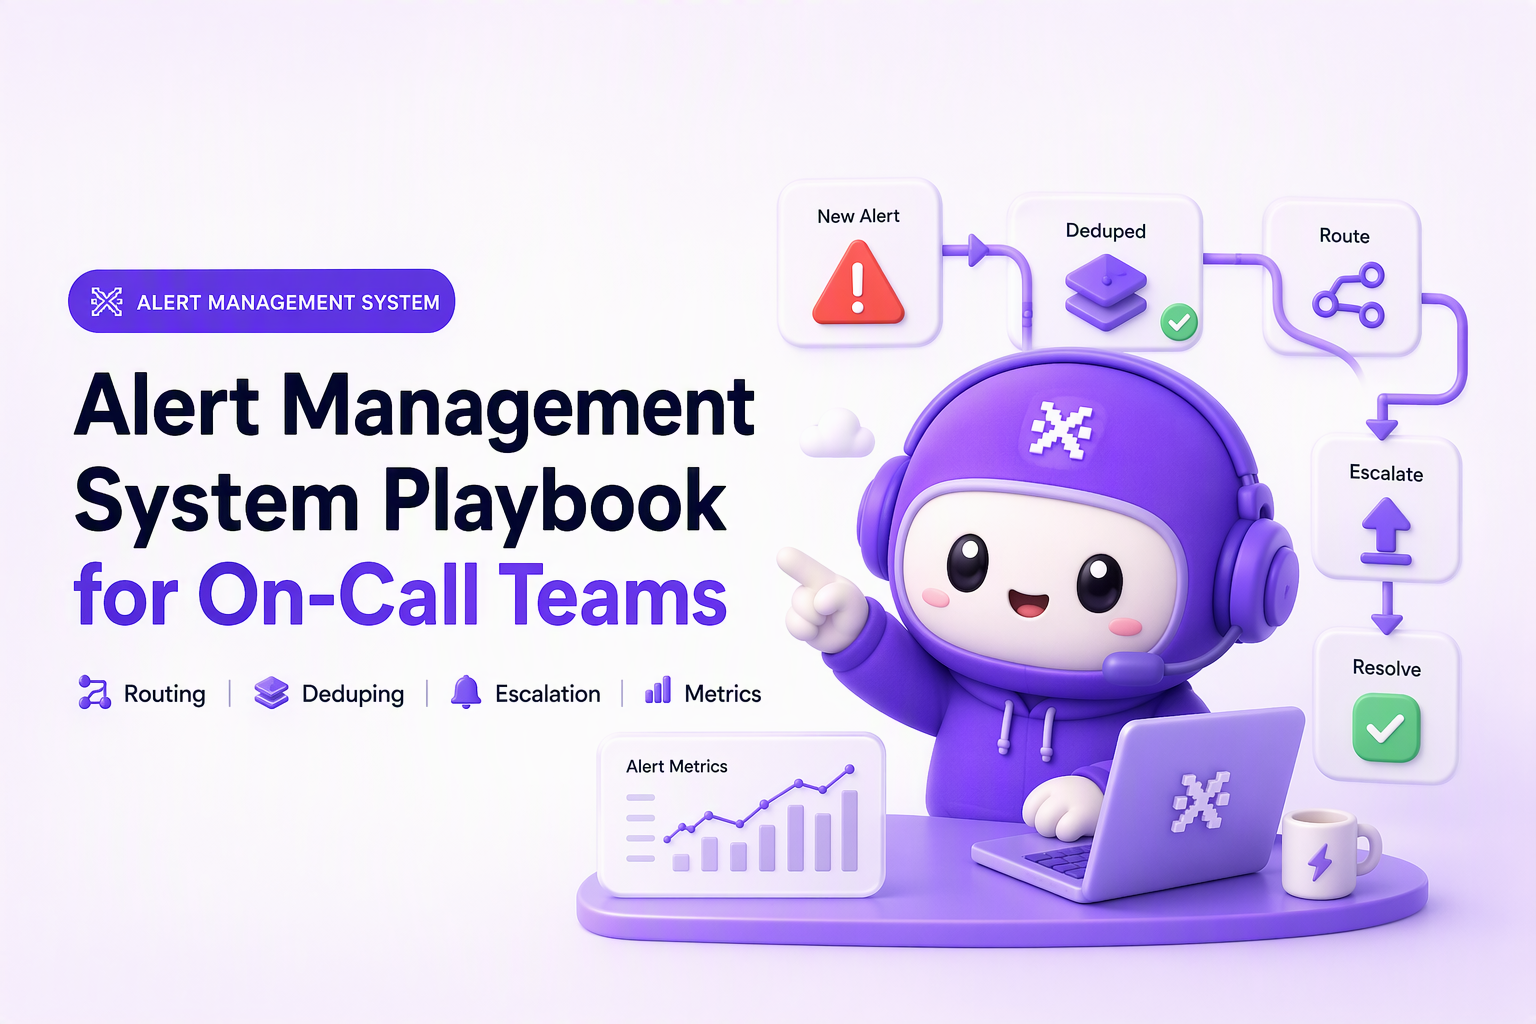
What an alert management system is and what it is not
An alert management system sits between detection tools and humans, enforcing consistent rules for grouping, routing, escalation, and reporting so on-call does not get flooded by raw events.
Disambiguation you can use in architecture reviews
- Alert system (detection): emits events (CPU high, error rate spike, queue depth). Examples: cloud monitors, APMs, log alerts.
- Alert management system (coordination): normalizes incoming alerts, dedupes, enriches, routes, escalates, and tracks outcomes.
- Incident management: governs the response process once you have an incident (roles, comms, postmortems, timelines).
Comparison table for “where should this live?” decisions
| Capability | Detection tool | Alert management system | Incident management |
|---|---|---|---|
| Trigger on metric/log condition | Yes | Sometimes (but avoid re-implementing monitoring) | No |
| Normalize fields into a common schema | Rare | Yes | No |
| Deduplicate and group repeats | Limited | Yes | No |
| Routing by service/team/severity/time | Limited | Yes | No |
| Escalation timeline and fallbacks | No | Yes | Sometimes |
| On-call schedules | No | Often | No |
| War room, comms, postmortems | No | No | Yes |
The core components of an on-call alert management system
An on-call alert management system works when it treats every inbound signal as data to be shaped into one clear interruption with an owner and context.
1) Intake and normalization (make alerts comparable)
Normalization is the fastest way to stop “each tool has its own severity semantics.” Pick a minimal schema and map every source into it:
- identity: alert_id, source, environment
- ownership: service, team, runbook_url
- impact: severity (P1-P4), customer_impact (yes/no), SLO_breach (yes/no)
- debug context: summary, fingerprint, top_signal (metric/log/span), recent_change (deploy id)
In our experience working with multi-service products, the single highest leverage mapping is getting service and environment correct on day one, because routing and dedupe both depend on it.
2) Deduplication and grouping (one page per problem)
Use two layers: exact dedupe to drop repeats, and grouping to cluster similar alerts into an “issue” concept.
- Exact dedupe key:
hash(source + alert_name + service + environment)within a sliding window (example: 5-15 minutes depending on signal frequency). - Grouping key:
hash(service + environment + failure_mode)where failure_mode can be error class, endpoint, or SLO indicator.
Concrete rule: if an alert fires 30 times in 10 minutes with the same grouping key, page once and keep updating the group’s counter; do not repage unless severity increases or the alert clears and reopens.
3) Enrichment (make the page actionable without extra clicks)
Enrichment adds the minimum context the responder needs in the first 60 seconds:
- Direct links: dashboard, logs query, trace view, runbook.
- Change context: last deploy, config flag changes, feature rollout status.
- Blast radius hint: affected region/tenant, % errors, SLO burn rate if available.
4) Routing (deterministic ownership beats “whoever sees it”)
Routing should be rules-first, not channel-first. A practical routing rule format:
- If environment=prod and severity in {P1,P2} then page primary on-call for owning team.
- If environment≠prod then send to team chat only (no page).
- If service missing/unknown then route to a triage queue with a strict SLA (example: 15 minutes to assign).
If you need a fuller routing structure, start with an alert management framework that defines inputs (fields), decisions (rules), and outputs (targets) as separate layers.
5) Escalation (timeboxed handoffs, not heroics)
Escalation is a timer plus a policy. The timer is “no ack/no progress by T,” and the policy is “who gets pulled in next.” A good starting point:
- P1: page primary immediately, escalate to secondary at T+5 minutes if unacked, escalate to team lead at T+15 minutes, add incident commander at T+30 if still active.
- P2: page primary, escalate to secondary at T+15 if unacked, move to daytime follow-up at T+60 if stabilized.
Document it explicitly as an escalation policy so responders do not have to negotiate escalation while production is burning.
A step-by-step setup playbook you can implement this week
A one-week alert management system build is realistic if you lock a severity matrix, a dedupe strategy, and an escalation timeline before you connect more sources.
Day 1: Define severity using a matrix, not vibes
Pick 2 axes and keep them binary enough to be repeatable. Example matrix:
- User impact: none, partial, major
- Time sensitivity: can wait until business hours, must respond now
Then map to P-levels:
- P1 = major impact + must respond now
- P2 = partial impact + must respond now
- P3 = impact but can wait
- P4 = informational
We initially assumed “anything that trips an SLO is P1,” but our team found that pages became desensitizing unless we reserved P1 for sustained or rapidly worsening customer-facing impact.
Day 2: Choose threshold rules that fire on “pressure,” not raw event spam
Thresholds work best when they reflect accumulated risk. Use “count over window” rules for logs and “burn rate” rules for SLOs. Examples you can paste into a spec:
- Error budget burn: page P1 if fast burn indicates you will exhaust the budget soon; otherwise route to chat.
- Log errors: page P2 if
count(error_fingerprint) >= 50 in 5mand affected endpoint is tier-1. - Queue lag: page P1 if lag exceeds a “data loss” threshold for 10 minutes, not on brief spikes.
For teams that struggle with repeated pages for the same underlying failure, a structured alert triage flow helps you decide whether to tighten thresholds, improve grouping, or add suppression.
Day 3: Implement dedupe keys and suppression rules
Write your dedupe and suppression as code or config, not tribal knowledge. A practical checklist:
- Dedupe window: pick 10 minutes by default; shorten for ultra-fast signals, lengthen for slow-burn queues.
- Repage conditions: severity increased, alert cleared then reopened, or a different grouping key appears.
- Suppression: maintenance windows, known noisy tenants, expected load tests, and dependency outages (avoid cascading pages).
Day 4: Encode escalation timelines and acknowledgements
Define what “ack” and “progress” mean. Example operational definitions:
- Acknowledged = responder confirmed receipt in the paging system.
- In progress = ticket/incident created and linked, or a responder note added with hypothesis and next step.
Then hardcode escalation steps so the system executes the policy. If you are aligning this with your wider response process, connect it to your incident alerting workflow so “page” and “declare incident” are distinct, deliberate actions.
Day 5: Link runbooks and require a minimum alert payload
Set a rule: any page-level alert must include (1) owner team, (2) runbook URL, (3) primary dashboard link, and (4) a grouping key. If it cannot, downgrade it to chat until the payload is fixed. In our experience, this one gate reduces on-call thrash because responders stop spending the first minutes figuring out what the alert even refers to.
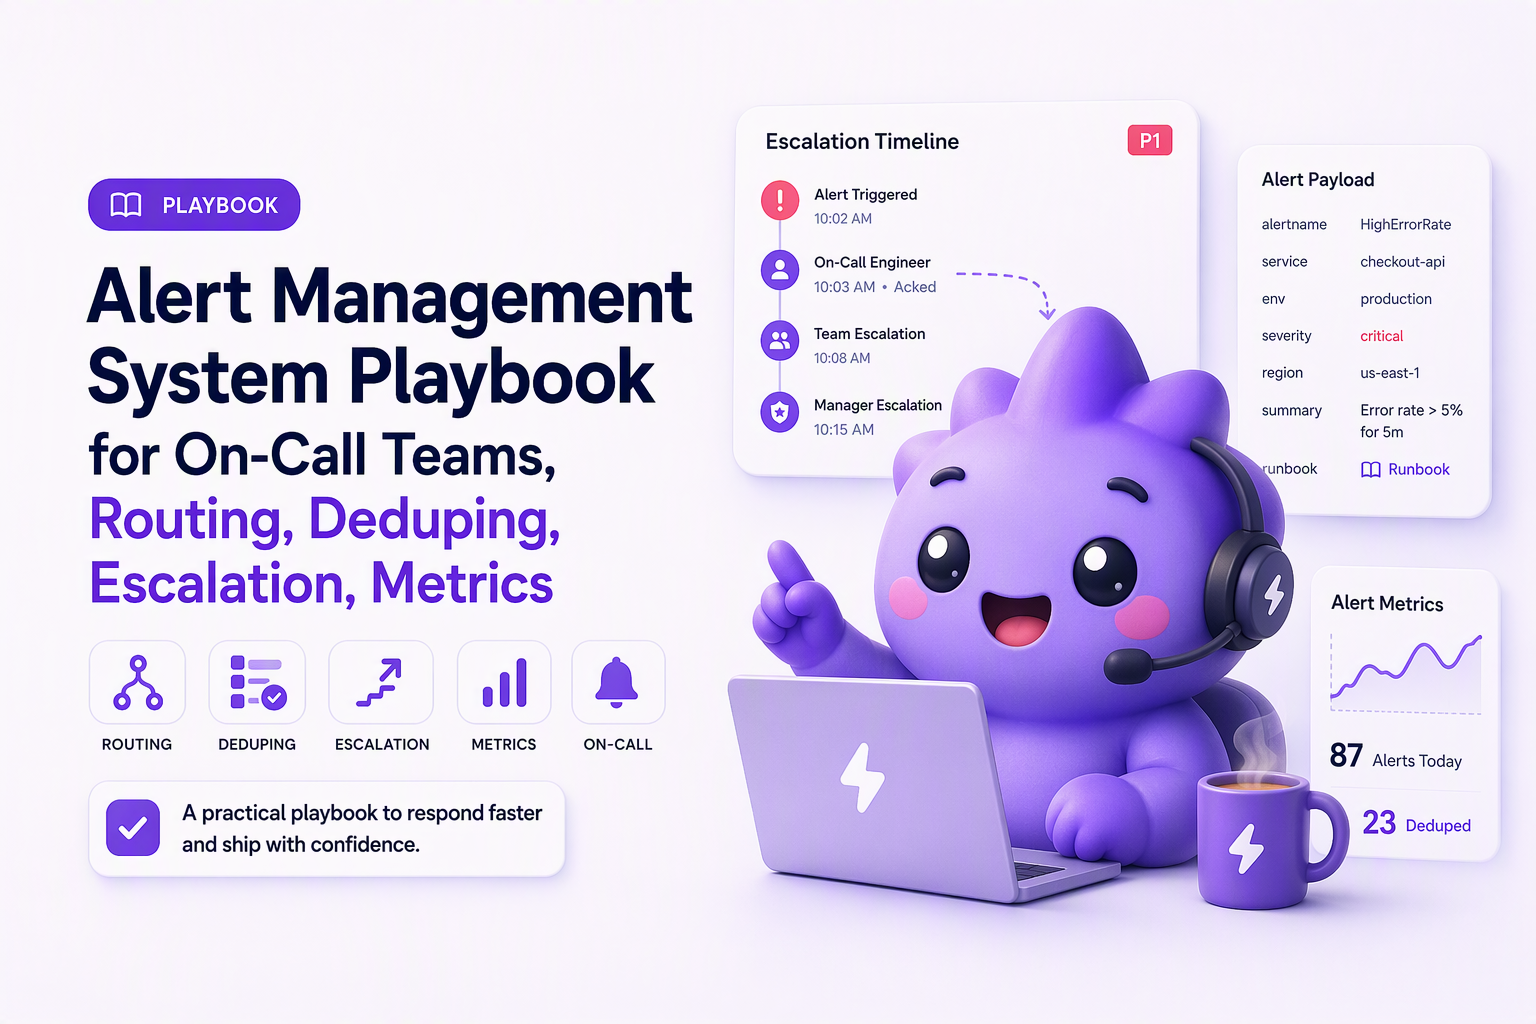
Alert-to-incident tracking, metrics, and continuous improvement
Alert management system quality improves fastest when every page produces a measurable outcome you can review weekly.
Map the lifecycle with explicit ownership handoffs
- Alert opens (owned by on-call responder): acknowledge, triage, decide page vs ticket vs ignore.
- Incident declared (owned by incident lead/IC): comms, coordination, timeline.
- Ticket created (owned by service team): remediation task with priority and due date.
- Alert closed: resolution noted, grouping key retained for future dedupe and learning.
Instrument KPIs that expose noise and latency
- MTTA (mean time to acknowledge): from alert fire to ack.
- MTTR (mean time to resolve): from alert fire to recovery.
- Noise ratio: pages that did not require action divided by total pages (define “action” as a linked ticket, rollback, config change, or incident declaration).
- Deduplication rate: number of raw events collapsed into grouped alerts (directionally useful for tuning).
Run a 30-minute weekly review: top 5 paging sources, top 5 grouping keys, and “should this have paged?” decisions. If you are evaluating tooling boundaries between paging and response coordination, keep a separate scorecard for incident mgmt so alert cleanup does not get conflated with post-incident process.
Free alert management options and where they break at scale
Free alert management system setups can work for small teams until grouping, schedules, and metrics become non-negotiable.
Practical free and low-cost patterns
- Chat-only routing: send alerts into Slack/Teams channels with conventions for ack and ownership.
- Email fan-out: simple but weak for time-to-ack and escalation.
- Webhook to a lightweight router: a small service that normalizes, dedupes, and routes to chat/email.
- Open-source on-call stacks: many teams start with OSS for paging and schedules, then add incident tooling later.
Capability checklist and “upgrade tripwires”
- Need grouping and repage rules: if one incident generates multiple pages per person per hour, you need better dedupe and grouping.
- Need schedules and escalation: if you are manually forwarding pages after-hours, you have already outgrown chat-only.
- Need reporting: if you cannot compute MTTA/MTTR and noise ratio from logs, you cannot improve systematically.
- Need multi-channel delivery: if chat is down or muted, you need tested fallbacks (email/SMS/phone depending on org policy).
| Stage | What you can get away with | What breaks | Minimal fix |
|---|---|---|---|
| Very small team | Chat channel + conventions | No escalation, weak ownership | Add schedules and an escalation timer |
| Multi-service | Per-service alert channels | Cross-service incidents spam multiple rooms | Normalize + group via shared keys |
| 24/7 coverage | Manual handoffs | Slow acks, missed pages | Automated escalation policy + fallbacks |
| Optimization phase | Ad hoc tuning | No proof of improvement | Instrument MTTA/MTTR/noise ratio |
FAQ
If your on-call signals are missing real product-impacting bugs or turning into noisy back-and-forth, Flash Log can complement your alert management system by automatically capturing and classifying bugs (even when users do not report them) so you can alert from grouped, actionable bug pressure instead of raw error exhaust.

Outlier Identification That Works, The 1.5 IQR Rule, Method Selection, and Excel Steps
Practical outlier identification workflow using 1.5×IQR, plus method selection (Z, MAD, Grubbs/ESD) and Excel formulas to label outliers.
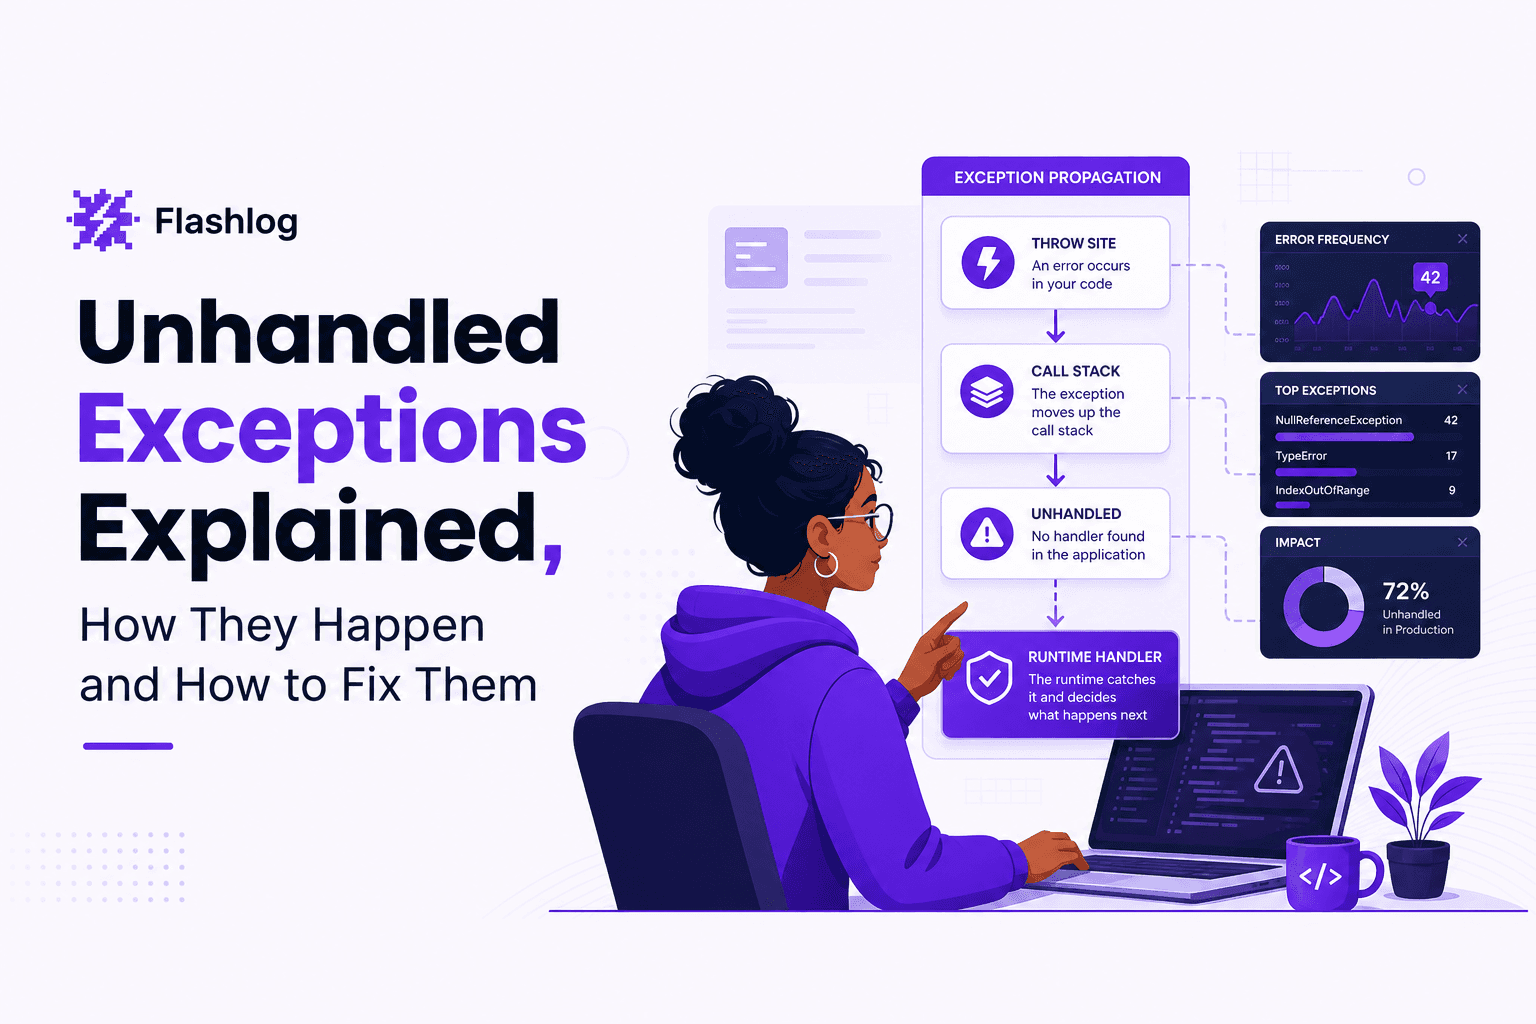
Unhandled Exceptions Explained, How They Happen and How to Fix Them
Learn what unhandled exceptions are, why they crash apps, and a practical flow to diagnose and prevent unhandled exceptions in production.
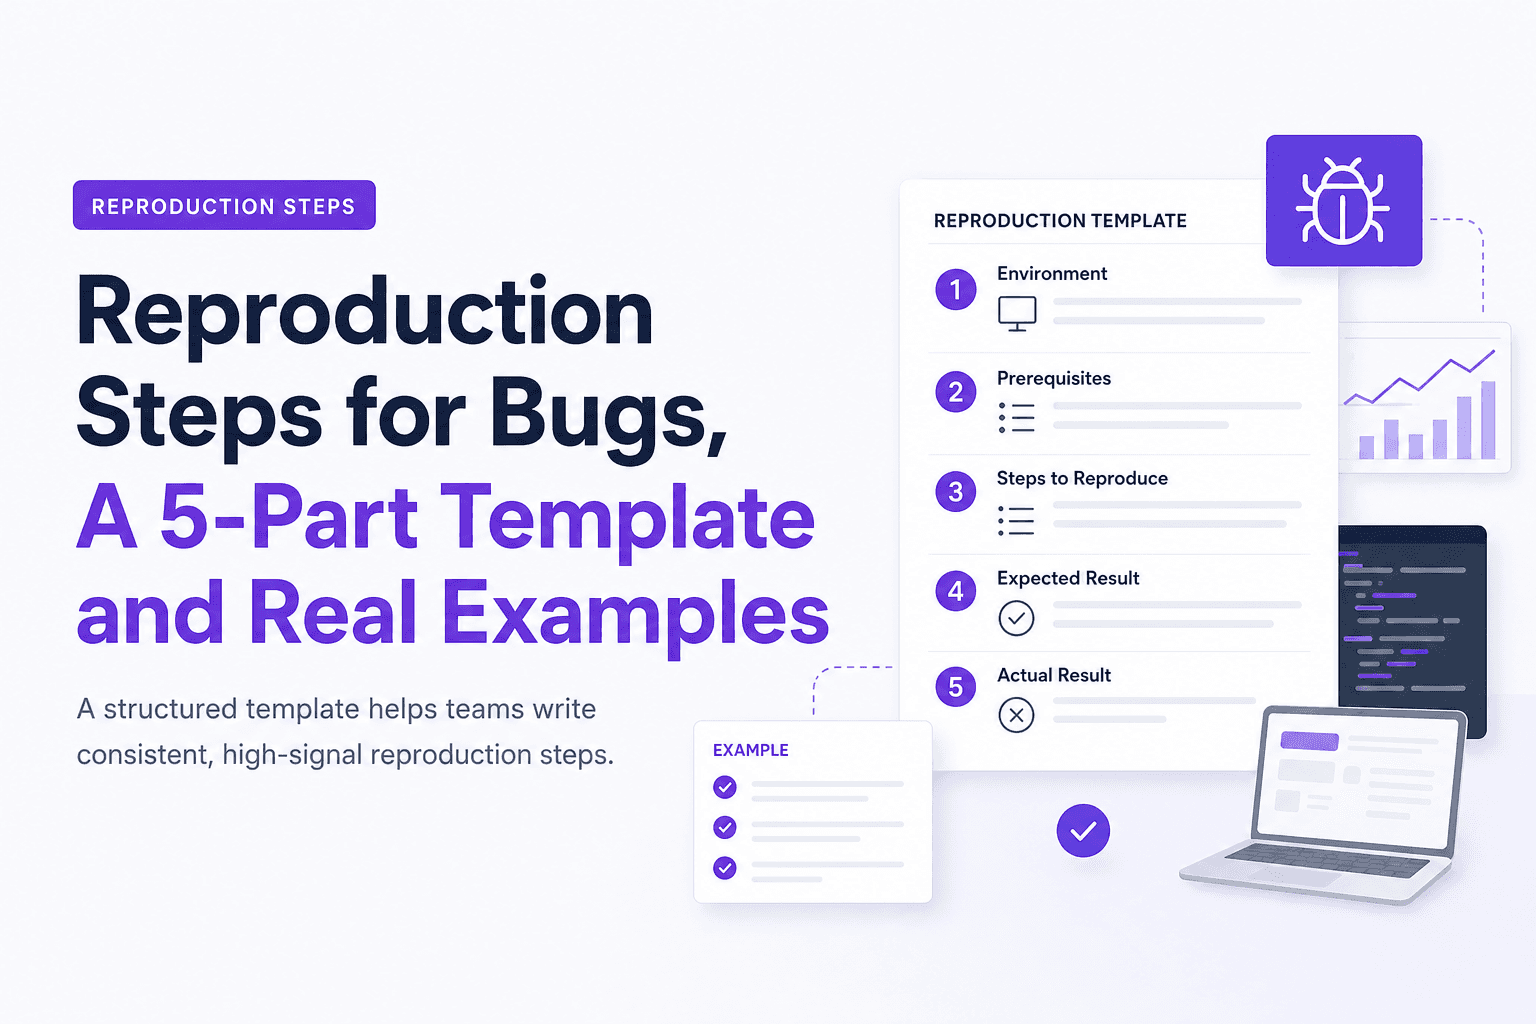
Reproduction Steps for Bugs, A 5-Part Template and Real Examples
Learn reproduction steps that engineers can actually follow: a 5-part template, diagram, and real web, mobile, and API examples.