
Web Session Replay, A Practical Tutorial and Debugging Workflow for Engineering Teams
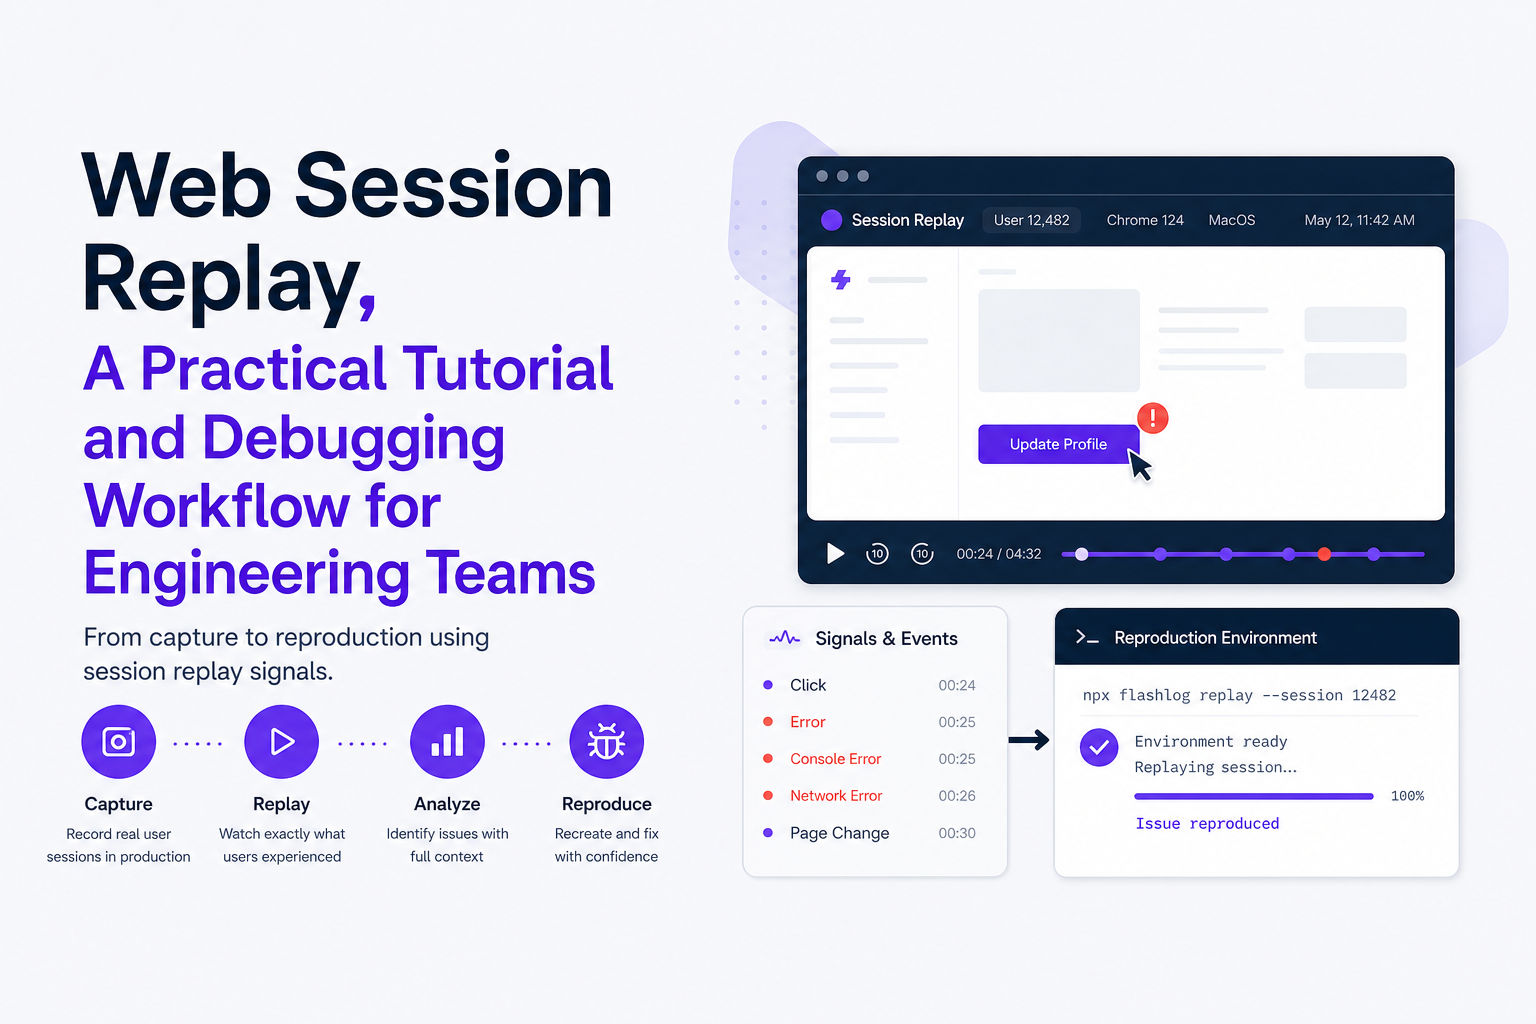
Web session replay is one of the fastest ways to stop guessing what users did right before a production bug, but only if you treat it as a debugging workflow (capture, triage, reproduce, resolve) rather than a gallery of videos.
- Replay is most useful when it is tied to technical evidence: user actions + console errors + failing network requests + environment context.
- Set privacy and access controls first (masking, consent, retention, RBAC) so you can safely scale web session replay in production.
- A repeatable workflow (instrument → verify privacy → capture → triage → reproduce → resolve) cuts back-and-forth with support and speeds root-cause analysis.
What Web Session Replay Captures and Why It Beats Guesswork
When teams say “we need session replay,” they usually mean “we need the missing context between a user action and a failure.” Done well, web session replay gives you a time-ordered trail that answers three debugging questions quickly: what the user did, what the app did, and what environment it happened in.
What you actually get from replay (signals you can debug with)
- User interaction trail: clicks, taps, scrolls, text input events (often masked), navigation, and SPA route changes.
- Page and UI state reconstruction: DOM mutations, layout snapshots, and UI state at key moments (depending on the tool’s capture approach).
- Timing context: when the user clicked vs when the network request started/ended, plus long tasks or blocked main-thread windows (if collected).
- Environment metadata: browser, OS, device class, viewport, locale, release/version, and sometimes network type.
- Technical breadcrumbs: console errors, uncaught exceptions, and network request summaries (again, tool dependent).
What replay does not guarantee (limitations to plan around)
- It is not a perfect screen video: many systems reconstruct UI from events and DOM changes, so some visual details can differ from the user’s actual pixels.
- It will not explain server-side state by itself: a replay might show “clicked Pay” and “error toast,” but you still need request IDs, backend logs, and feature-flag state to close the loop.
- It can miss the bug if sampling or triggers are wrong: if you only capture 5% of sessions or only on certain pages, you may never record the failing path.
A simple “debug value score” for deciding what to capture
To keep replay useful (and cheaper), score each capture signal from 0 to 2 across three criteria, then keep the highest total:
- Repro power: does it help create deterministic steps?
- Root-cause power: does it point to a failing component (UI, API, auth, caching, third party)?
- Privacy risk: does it increase exposure of sensitive data?
In our experience working with SaaS teams, the biggest win is not “more replay,” it is replay plus network and environment context, because that combination turns “I saw it happen” into “I can reproduce it on build X in browser Y.”
How Web Session Replay Works Under the Hood Without the Hand-Waving
Understanding the capture model matters because it affects fidelity, performance overhead, and what kinds of bugs you can diagnose. Most web session replay systems fall into two broad approaches, and many tools combine them.
Two capture models: DOM reconstruction vs pixel streaming
- DOM and event-based reconstruction (common on the web): the SDK records a baseline snapshot (HTML/CSS/DOM) plus incremental updates (mutations), and replays them with a player. This is efficient and searchable, but can diverge visually when fonts, third-party widgets, or timing differ.
- Pixel/video-like capture (less common for web, more common for native): records frames. Fidelity can be higher, but bandwidth and storage costs are typically higher and redaction can be harder.
Fidelity tradeoffs you should test for before rollout
Run a quick pre-rollout test across your most complex pages (checkout, dashboards, rich editors) and verify these failure modes:
- Dynamic UI drift: animations, virtualized lists, and canvas elements may not replay faithfully.
- Third-party embeds: payment iframes, chat widgets, and consent banners can be missing or blocked in replay.
- SPA navigation: route changes can look like “teleporting” if your instrumentation does not track history events correctly.
Performance overhead and how to keep it predictable
Replay SDKs add CPU, memory, and network overhead. A practical way to keep this under control is to set a budget and measure it:
- CPU budget: watch for long tasks and main-thread blocking during heavy UI interaction.
- Network budget: measure bytes uploaded per minute of active use; set compression and batching thresholds.
- Sampling and triggers: capture 100% for error sessions (exceptions, 4xx/5xx bursts) and sample the rest.
We initially assumed “capture everything” would be fine for a small app, but our audits showed the overhead spikes on pages with frequent DOM mutations, so we got better results by capturing more aggressively only around errors and key funnels.
A Tool-Agnostic Web Session Replay Tutorial You Can Run This Week
This is a practical, end-to-end checklist you can execute in a few hours. The goal is not just to “see replays,” but to confirm you can capture, mask, and retrieve sessions that lead to actionable bug reports.
Step 1: Instrument the SDK with a minimal, reversible setup
- Add the replay SDK via your tag manager or app bundle, but keep it behind an environment flag (for example, enable in staging first).
- Attach release metadata (commit SHA or semantic version) so you can correlate issues to deployments.
- Define capture scope: start with 2 to 4 critical user journeys (signup, login, checkout, settings) rather than the entire app.
Step 2: Verify masking and redaction before you record real users
Use a “privacy test script” that a developer can run in staging in under 5 minutes:
- Type an email, password, and fake card number into your forms.
- Trigger a validation error so the UI renders error states.
- Replay the session and confirm sensitive inputs are masked, and that DOM text nodes with secrets are not captured.
Also verify that search boxes, support chat inputs, and any “notes” fields are treated as sensitive by default.
Step 3: Generate a known-bad test session with a controlled failure
Create a deterministic failure so you can validate your workflow end to end:
- Force an API error in staging (return a 500 for a single endpoint).
- Trigger a frontend exception in a test route.
- Simulate a slow network (Chrome DevTools throttling) to see whether timing context remains usable.
Step 4: Validate retrieval and triage speed (the “2-minute rule”)
Set a standard: within 2 minutes, an engineer should be able to open the session, identify the last meaningful user action, and see the related console or network clue. If you cannot meet this, adjust indexing, event markers, or how sessions are linked to errors.
Step 5: Decide how replay connects to your issue tracker
The most effective teams treat replay as an attachment, not a destination. At minimum, make sure a bug ticket can include: a replay link, timestamp of the failure, release version, and the failing request details. If you want a reference workflow, this session replay guide shows how to structure the handoff so engineering gets reproducible context instead of a vague report.
Debugging Walkthrough From Web Session Replay to Root Cause Using Console and Network Clues
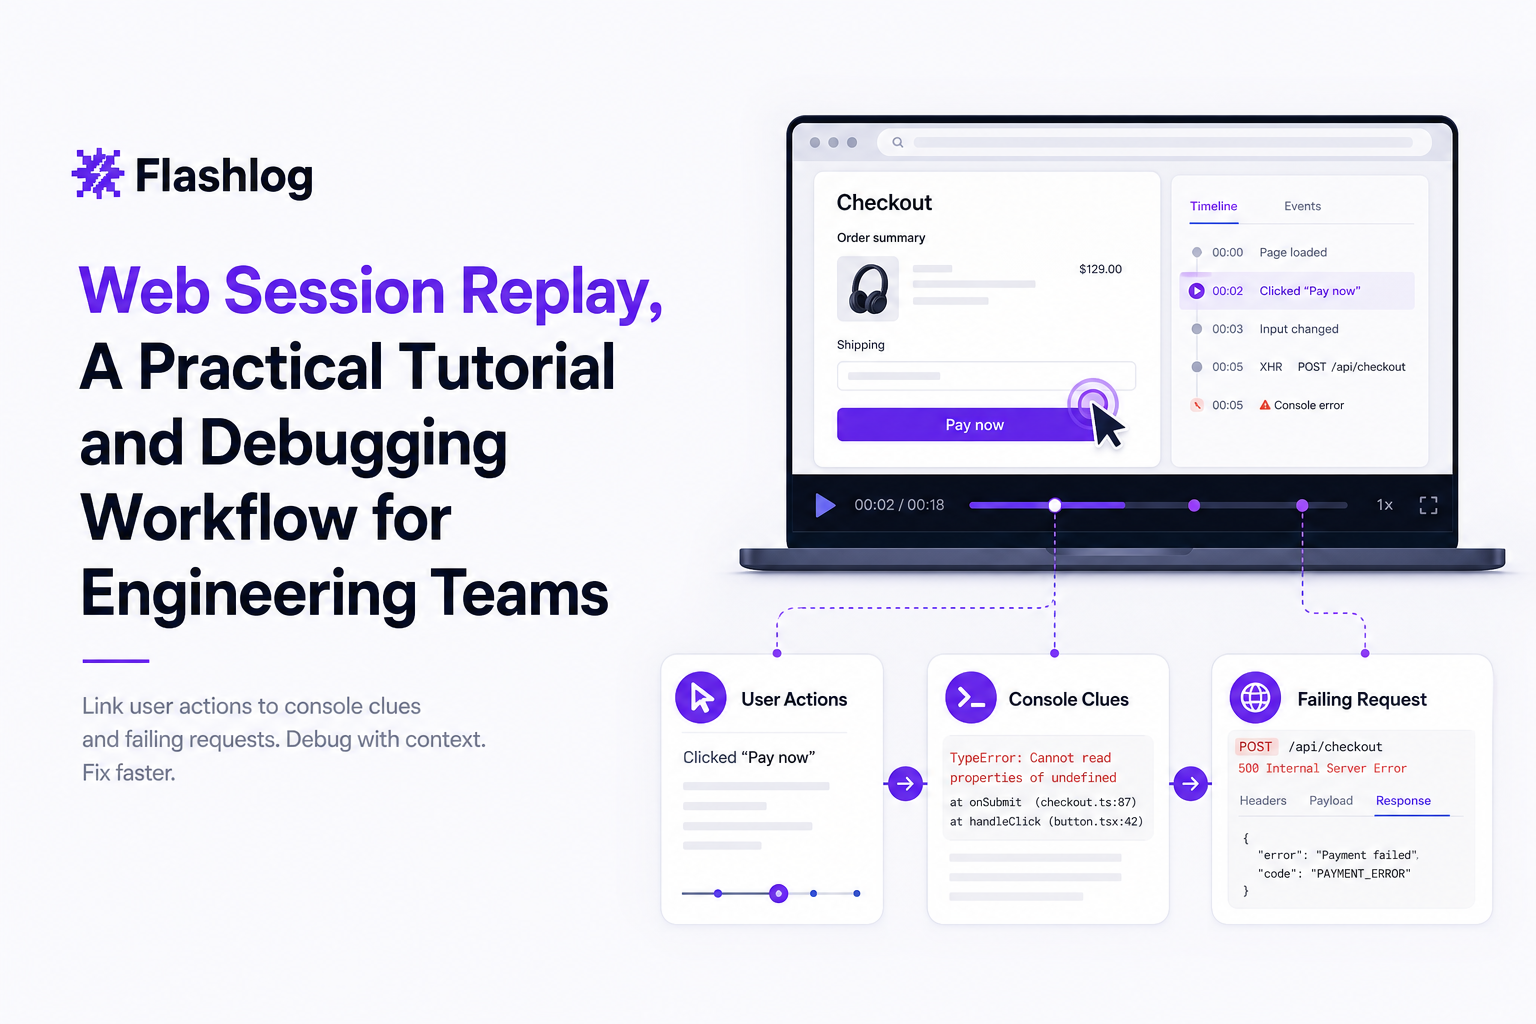
Here is a concrete walkthrough based on a common production pattern: “checkout fails for some users, but we cannot reproduce.” The point is to show decision points and artifacts you should extract from web session replay, not just “watch the replay.”
The bug report you start with (what support usually has)
- User says: “Payment failed after I clicked Confirm.”
- Browser: “Chrome on mobile.”
- No screenshot, no steps, no timestamp.
Step-by-step triage using replay artifacts
- Find the failure moment: jump to the last click before the error UI state (for example, “Confirm order”). Note the timestamp.
- Check console signals: look for an uncaught exception or a logged error right after the click. If you see a CORS error, a blocked third-party script, or a JSON parse error, you already have a direction.
- Inspect the network trail: identify the request triggered by the click. Capture method, endpoint, status code, and latency. A 500 suggests backend or integration; a 401 suggests auth/session; a 422 suggests validation mismatch.
- Confirm environment context: browser version, OS, viewport, release, feature flags (if captured). Environment-specific bugs are common in mobile Safari, older Chromium builds, or when a new release toggles a flag.
- Extract reproduction steps: write steps as a deterministic sequence: entry page, selections, form fields (without sensitive values), and the final action. If you need a template, use this reproduction steps format so engineers get consistent tickets.
Turning the replay into a root-cause hypothesis
Suppose the replay shows:
- Click “Confirm order”
- POST
/api/checkoutreturns 500 in ~800 ms - Console logs:
TypeError: Cannot read properties of undefined (reading 'id')right after response handling
A tight hypothesis is: “Backend returns an error payload shape that the frontend does not handle, causing a client exception and an unhelpful UI error.” The next step is to pull backend logs for the request (use request IDs if available), then add a frontend guard plus a clearer error state.
What surprised our team was how often the “root cause” was visible only after combining the replay with the failing request metadata; watching the UI alone looked like a generic toast, but the network status and timing narrowed it to one endpoint quickly.
Where web session replay fits with other debugging tools
Replay is strongest at answering “what happened right before the failure.” Pair it with:
- APM and backend logs for request traces and database errors
- Feature flag audit trails for rollout-related regressions
- Error monitoring for stack traces and grouping
If you are evaluating tooling, a session replay software checklist can help you verify whether a vendor exposes the specific artifacts you need (network, console, environment) rather than just playback.
Privacy, Compliance, and Access Controls That Keep Replay Safe in Production
Privacy is not a legal afterthought for replay; it is a design constraint. The practical goal is: capture enough context to debug, while minimizing sensitive data exposure and limiting who can access sessions.
A production-ready replay privacy checklist (GDPR-aligned)
- Mask by default: passwords, tokens, card data, SSNs, health data, and any free-text fields that could contain sensitive info.
- Redact on capture, not just on view: ensure sensitive values never leave the browser unmasked.
- Consent and notice: implement consent banners where required, and document replay in your privacy policy. Use GDPR guidance as a baseline: GDPR.
- Role-based access control (RBAC): not everyone needs replay access. Common pattern: support can view high-level steps, engineering can view technical details, security/admin can audit access.
- Retention limits: set a retention window (for example, 7 to 30 days) and shorten it for higher-risk pages.
- Auditability: log who accessed which session and when, and review access periodically.
Governance that keeps replay useful (not creepy or noisy)
Two lightweight rules prevent most problems:
- Page allowlist: explicitly allow capture on pages where replay adds debugging value, and block capture on account, billing, or medical pages unless you have strong masking and a clear need.
- Trigger-based capture: record full fidelity around errors (exceptions, failed requests) and lower fidelity elsewhere.
If you want a deeper explanation of what to mask and what replay systems typically capture, this session replay technology breakdown is a useful reference, and it pairs well with understanding when you should choose session recording vs event-only analytics.
| Workflow stage | What to verify | Concrete acceptance check |
|---|---|---|
| Instrument | Release tags + critical routes captured | Replay shows app version and route changes for signup/login/checkout |
| Verify privacy | Masking and redaction | Passwords and payment fields are unreadable in capture and playback |
| Capture | Triggers and sampling | Error sessions are captured at higher rate than normal sessions |
| Triage | Find last action + related error quickly | Engineer can identify action, error, and endpoint within 2 minutes |
| Reproduce | Steps + environment are sufficient | Ticket includes steps, browser/OS, release, and failing request details |
| Resolve | Fix validation | Replay (or a new test session) confirms the flow completes successfully |
FAQ about web session replay
If you want to operationalize this workflow so issues come with reproduction context automatically, Flash Log is designed to capture the user journey, failing request, environment details, and privacy-masked replay context around each issue so engineers can reproduce bugs without asking users to explain what they did.
The Debugging Workflow That Cuts Production Investigation Time Without More Meetings
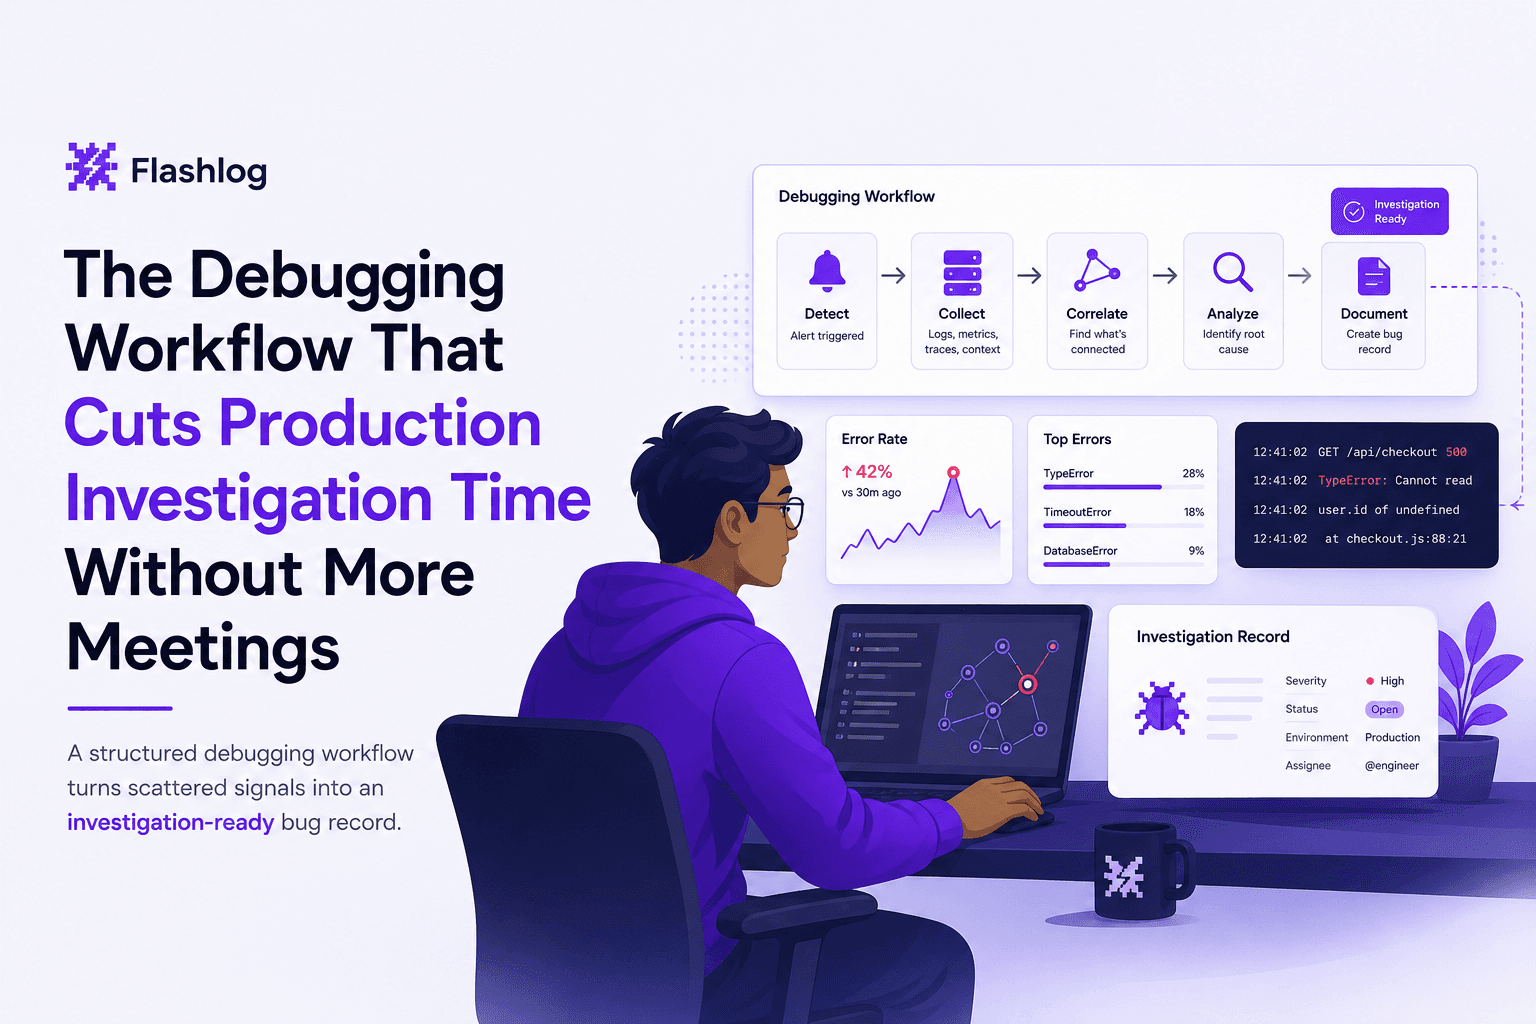
Learn a repeatable debugging workflow to debug production issues faster with clearer signals, faster triage, and less back-and-forth.

Notification Fatigue Explained and a Simple Reset Plan You Can Finish This Week
Learn what notification fatigue is, how to diagnose it, and a practical reset plan for phone, email, chat, and social without going off-grid.
Issue Triage for Production Bugs - A 10-Minute Framework to Find Signal Fast
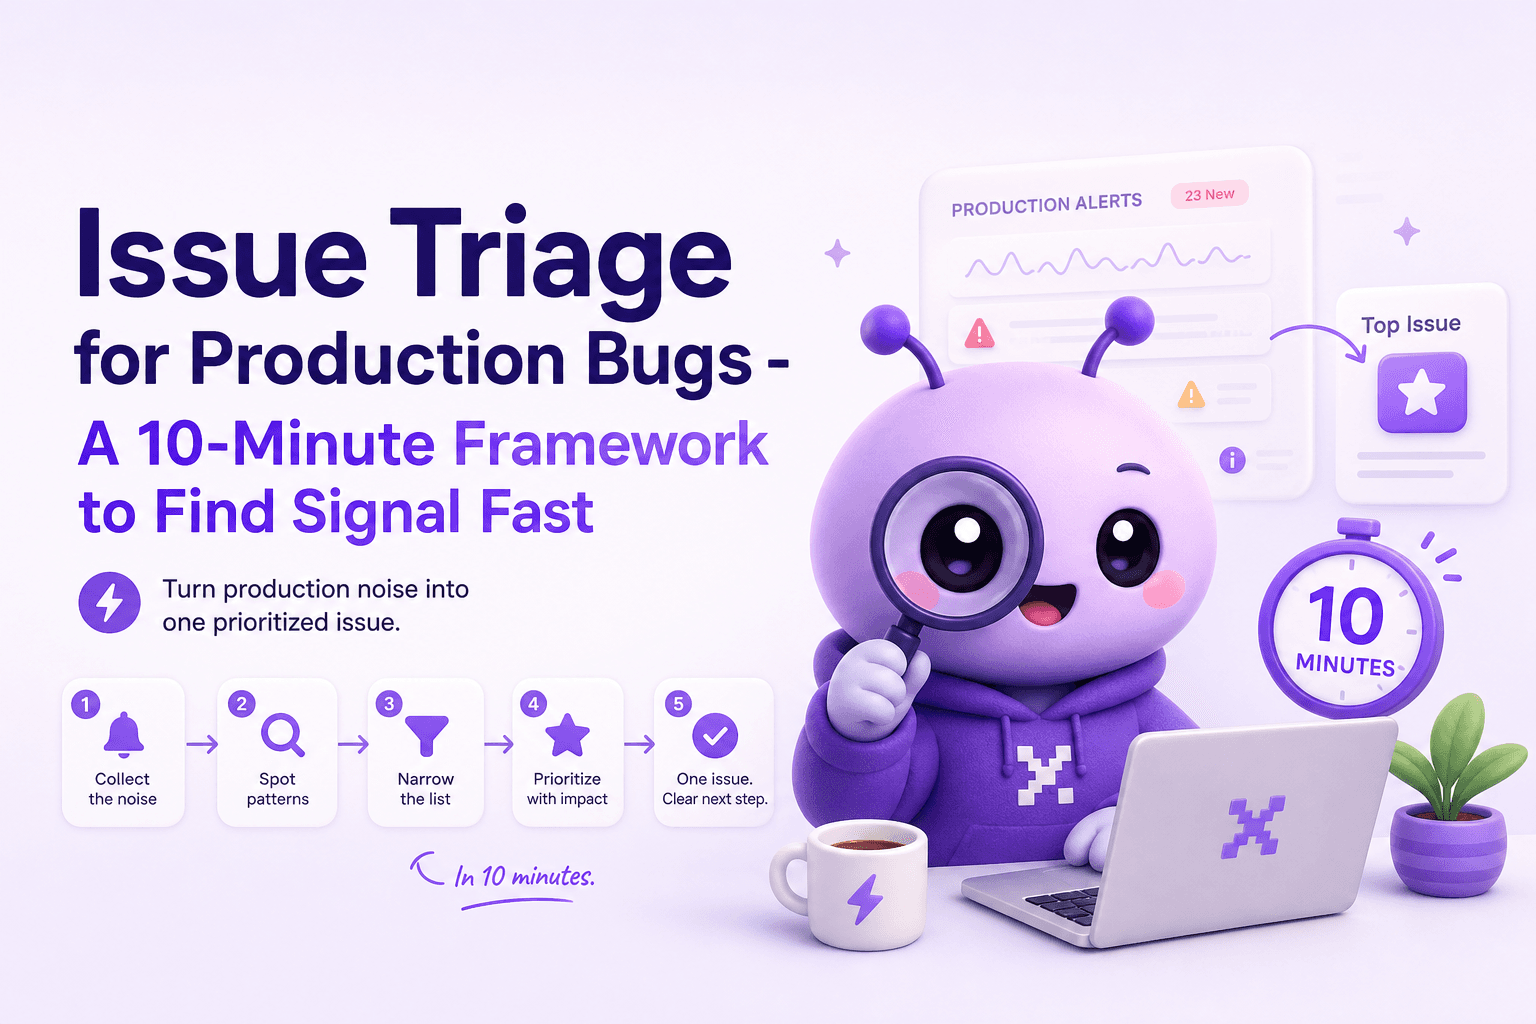
Learn a 10-minute issue triage framework to prioritize production bugs, scope impact, and capture the right evidence fast.